The macroeconomic landscape in April 2026 is being shaped significantly by the U.S.-Iran military conflict, which has sent energy prices surging, rattled consumer confidence, disrupted global supply chains, and triggered a dramatic flight to safe-haven assets. Many of the readings below reflect this turbulent backdrop. A temporary cease-fire was announced recently but market and consumer uncertainty remains elevated.
Hard economic data from Q1 2026 — retail sales, payrolls, ISM PMIs — remains relatively solid. But soft data — consumer confidence (47.6 historic low), investor sentiment (persistent bearish majority), and inflation expectations (4.8%, surging) — has collapsed.
Historically, soft data tends to lead hard data by 1–3 months. Q2 2026 will be the decisive test of whether the geopolitical shock and sentiment collapse translate into a real economic contraction.
The Fed's Dilemma: Inflation is re-accelerating above 3% with energy at +12.5% and expectations surging to 4.8%. Yet growth is decelerating (1.3% GDP nowcast) and unemployment is rising. Cutting rates risks embedding inflation; holding rates risks tipping a fragile economy into recession. This is the most difficult monetary policy environment since 2022.
Contents
- Atlanta Fed GDP Nowcast
- Conference Board LEI
- US Dollar Index
- Commodities (GSCI)
- Gold
- Bitcoin
- CPI Inflation
- Producer Price Index
- Yearly Inflation Rate
- CPI Components
- 1-Year Inflation Expectations
- Consumer Sentiment
- Investor Sentiment (AAII)
- ISM Manufacturing PMI
- ISM Services PMI
- Industrial Production
- Retail Sales
- Non-Farm Payrolls
- Total Vehicle Sales
- Manheim Used Car Index
- US New Home Sales Supply
- 30-Year Mortgage Rate
- Unemployment Rate
- Jobless Claims
- Yield Curve (10Y–2Y)
- High Yield OAS Spread
- Put/Call Ratio
- S&P 500 Valuation & Earnings
Atlanta Fed GDP Nowcast
↗ Source: atlantafed.orgAs of April 9, 2026, the Atlanta Fed's GDPNow model estimates that real GDP growth for Q1 2026 came in at approximately 1.3% SAAR — a significant deceleration from the ~3% pace tracked in late January. The nowcast has declined steadily as incoming data on trade, consumer spending, and business investment softened throughout the quarter.
The Blue Chip consensus of professional forecasters sits near 2.0%, above the model estimate, suggesting the real-time GDPNow is picking up near-term weakness that survey-based forecasts are slower to incorporate. The Atlanta Fed emphasizes GDPNow is a model-based projection, not an official Fed forecast.
The U.S. economy appears to have grown at a sluggish 1.3% pace in Q1 2026, well below the 3% seen at year-start. Momentum is decelerating heading into Q2 — a concerning trend.
Conference Board Leading Economic Index (LEI)
↗ Source: conference-board.orgThe Conference Board's LEI fell to 97.5 in January 2026, a 0.1% monthly decline following a 0.2% drop in December. Over six months (July 2025–January 2026), the index declined 1.3%.
Despite persistent softness, the LEI has not triggered a formal recession signal. The Conference Board's threshold requires the six-month diffusion index to fall below 50. As of January, 7 of 10 components advanced on a six-month basis for three consecutive months, keeping the diffusion index above the danger zone. Key headwinds include weakening consumer expectations and building permits. The Conference Board has revised its 2026 GDP forecast down to 2.0% YoY, noting geopolitical impacts not yet fully captured by the index.
No recession is formally predicted for the next two quarters by the LEI, but the persistent downward trend and geopolitical headwinds warrant close monitoring. The formal alarm has not been triggered — yet.
US Dollar Index (DXY)
↗ Source: TradingView / FinvizThe US Dollar Index is currently trading at 98.49 — below the psychologically critical 100 level and representing a significant decline from both one month and one quarter ago. The dollar has been under sustained pressure from: a dramatic flight to gold and other safe-haven assets driven by the Iran conflict, slowing U.S. growth expectations, and rising bets that the Fed may need to cut rates sooner than previously anticipated.
The move below 100 is meaningful — earlier in Q1 2026, the DXY was trading well above 104. A weaker dollar has direct inflation implications, as it raises import costs across nearly every category of goods.
The dollar has weakened materially — down roughly 5–10% from its January 2026 levels. This adds to inflationary pressures via higher import costs and signals broader concern about U.S. economic prospects relative to global peers.
Commodities — S&P GSCI Index
↗ Source: Trading EconomicsThe S&P GSCI — a broad, production-weighted composite index spanning energy, metals, agriculture, and livestock — closed at 704.67 on April 10, retreating from a recent 11.5-year high hit in early March 2026 (its highest level since October 2014). The index is up nearly +2% over the past month and a staggering +34.18% year-over-year.
The energy complex dominates the GSCI's weighting. With WTI crude near $95.63 and Brent at $94.26 — both significantly elevated from 2025 levels — the Iran conflict remains the primary driver of commodity price pressure across the board.
Commodity prices are at multi-year highs and a 34% annual surge is feeding directly into producer and consumer inflation. This is the most inflationary commodity environment since 2022.
Gold
↗ Source: Finviz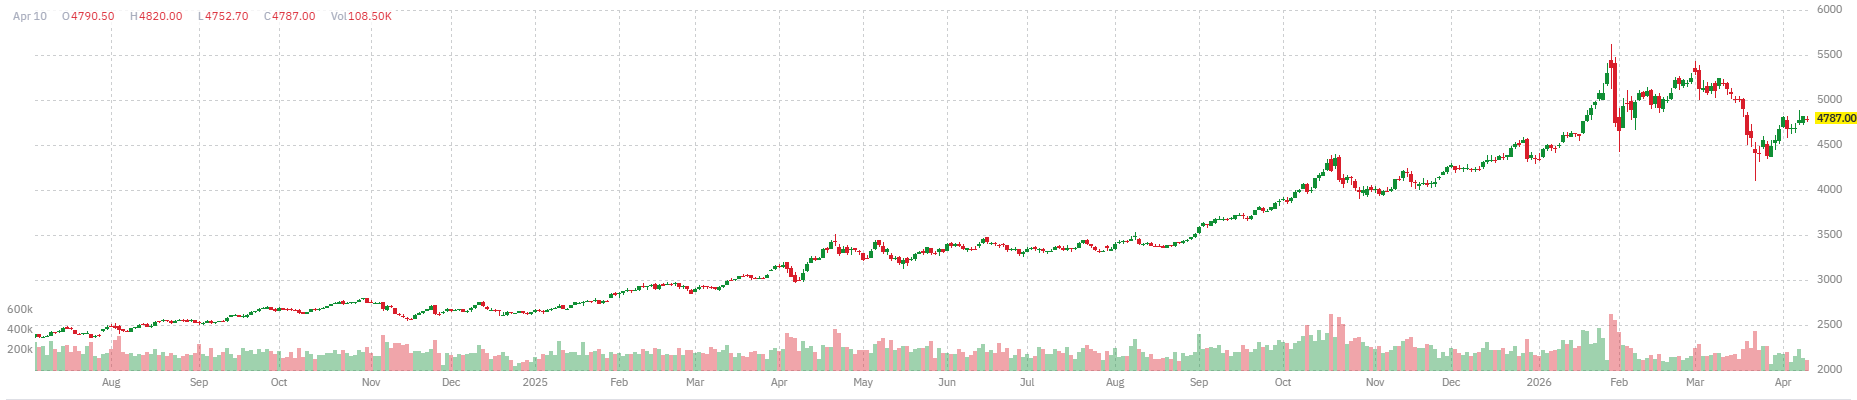
Gold is trading at $4,771 per troy ounce, near all-time record levels. The move above $4,000 — and now above $4,700 — reflects extraordinary safe-haven demand, dollar weakness, and inflation hedging. One quarter ago (January 2026), gold was trading significantly lower; the surge reflects the geopolitical shock of the Iran conflict driving a massive reallocation to precious metals.
The broader precious metals complex has surged in tandem: Silver at $76.03, Platinum at $2,055, and Copper at $5.87 (also near multi-year highs, driven by industrial demand and supply disruptions).
Gold is in a historic bull run, trading at or near all-time records. The magnitude of the move signals deep investor concern about inflation, geopolitical risk, and dollar credibility.
Bitcoin
↗ Source: Finviz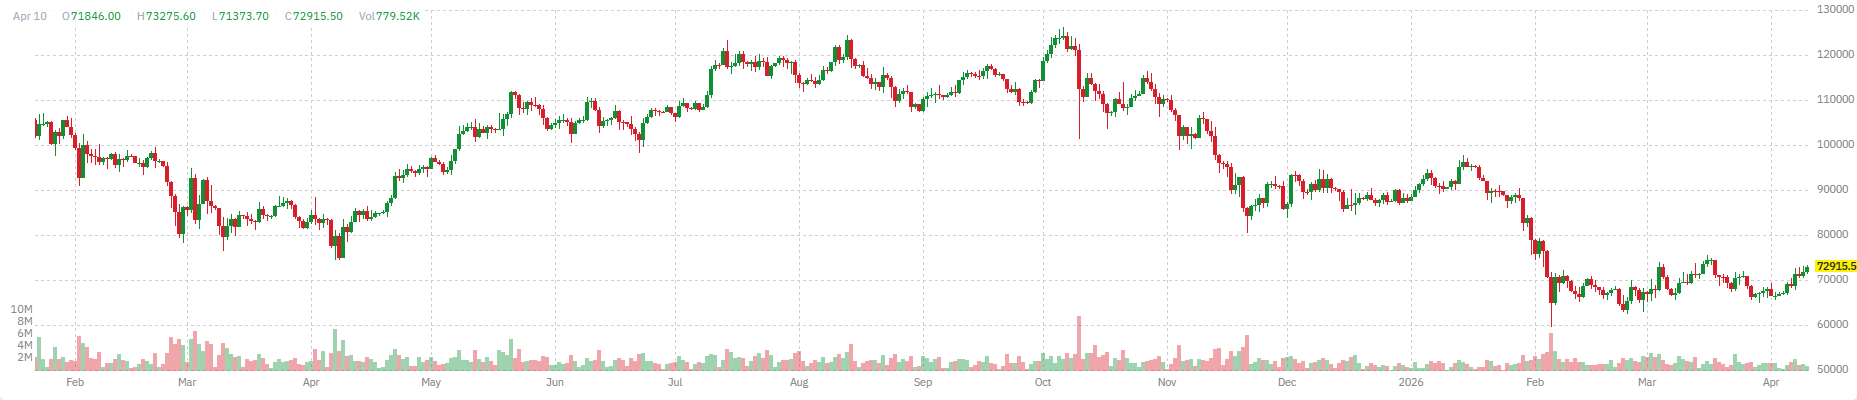
Bitcoin is trading at $73,630, recovering modestly on the day. Bitcoin has experienced significant volatility in 2026 — initially selling off during peak geopolitical uncertainty before partially recovering as some investors treated it as a digital store of value alongside gold. However, Bitcoin has underperformed gold significantly as a safe-haven asset during this cycle, reflecting its higher correlation with risk assets and its sensitivity to macro liquidity conditions.
In January 2026, Bitcoin was trading at higher levels before the geopolitical shock triggered risk-off selling. The recovery to $73,630 shows resilience, but the dramatic appreciation in gold (+100%+ from 2024 levels) relative to Bitcoin underscores that traditional safe havens have dominated this crisis.
Bitcoin remains above $70,000 but has clearly underperformed gold as a crisis hedge. It is recovering but has not kept pace with the commodity and precious metals rallies. Crypto's role as "digital gold" faces continued scrutiny.
Inflation (CPI)
↗ Source: BLS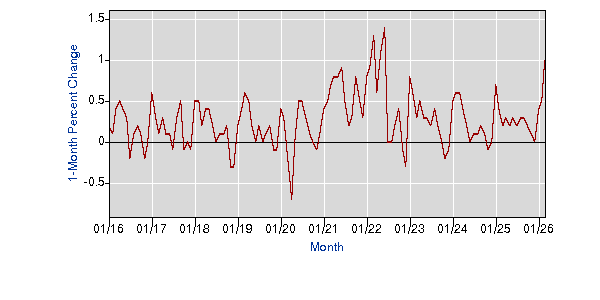
| Measure | Monthly (NSA) | Monthly (SA) | Yearly |
|---|---|---|---|
| CPI-U All Items | +1.0% | +0.9% | +3.3% |
| Core (ex-Food & Energy) | +0.3% | +0.2% | +2.6% |
| Medical Care | -0.1% | -0.2% | +3.1% |
| CPI-W All Items | +1.3% | +1.1% | +3.3% |
The March 2026 CPI report showed a sharp acceleration in headline inflation — the annual rate jumped from 2.4% in February to 3.3% in March, its highest level since May 2024. The primary driver is energy: gasoline is up +18.9% YoY and fuel oil +44.2% YoY, both directly attributable to the Iran conflict's impact on global oil markets. Core inflation, at 2.6%, remains more contained, indicating the shock is concentrated in energy.
Headline inflation re-accelerated sharply to 3.3% in March 2026. The Fed faces a classic stagflationary dilemma — growth is slowing while inflation is heating up, driven by an exogenous energy shock. A single bad month? Or the start of a new inflationary wave? Q2 data will be decisive.
Producer Price Index (PPI)
↗ Source: BLS
| Category | MoM Change (Feb 2026) |
|---|---|
| Diesel Fuel | +13.9% |
| Carbon Steel Scrap | +5.6% |
| Crude Petroleum | +4.7% |
| Steel Mill Products | +3.0% |
| Foods (Final Demand) | +2.4% |
| Gasoline | +1.8% |
| Meats | +1.4% |
| Industrial Chemicals | +1.3% |
| Core Goods | +0.3% |
| Apparel & Jewelry Retailing | -3.2% |
Producer prices rose +0.7% MoM (seasonally adjusted) in February 2026 and are up +3.4% year-over-year — showing that inflationary pressures are deeply embedded in the production pipeline. The diesel fuel surge of +13.9% MoM underscores the energy shock's cascading effect on virtually all goods transportation and manufacturing costs.
The PPI is hot and trending hotter. Energy and food input costs are surging at the producer level. Given the typical 2–3 month lag between PPI and CPI, the March CPI shock confirms pass-through is already occurring — and likely has further to run into Q2.
Yearly Inflation Rate
↗ Source: Trading Economics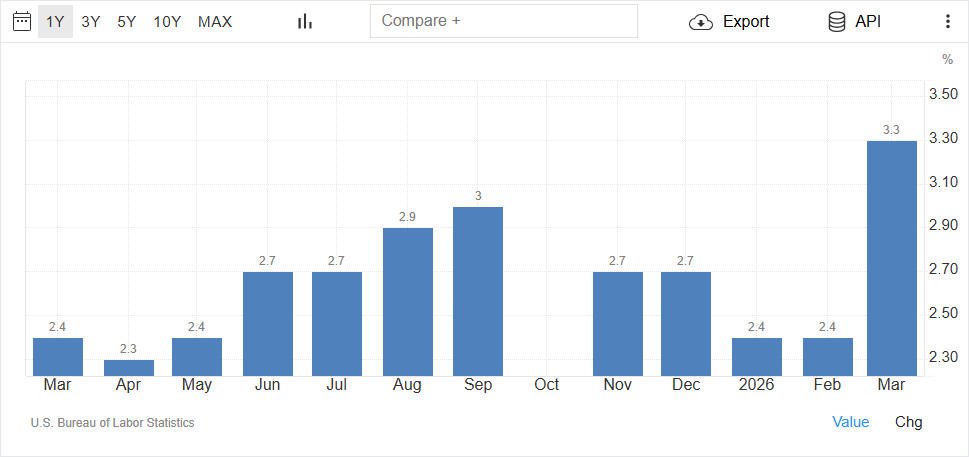
The reported yearly CPI inflation rate for March 2026 is 3.3%, representing a significant re-acceleration from the 2.4% posted in both January and February. This is the highest annual inflation reading since May 2024 and reverses the disinflation trend that had been making progress through 2025. The primary cause is elevated energy prices — gasoline and fuel oil costs have surged due to the Iran conflict's disruption of global oil supply. Economists at the Conference Board and major banks have already revised their 2026 inflation forecasts higher.
Annual inflation jumped nearly a full percentage point in a single month, from 2.4% to 3.3%. This is not noise — it is a clear signal of an external price shock working its way through the economy. The Fed's 2% target now seems distant.
CPI Components
↗ Source: BLS| CPI Category | 12-Month Change (Mar 2026) | Signal |
|---|---|---|
| Energy | +12.5% | Top Driver ↑ |
| All Items (Headline) | +3.3% | Accelerating |
| Food | +2.7% | Above Target |
| All Items Less Food & Energy (Core) | +2.6% | Near Target |
Energy is unambiguously the top contributing component at +12.5% YoY — nearly 5x the core inflation rate. This is a dramatic departure from February 2026, when energy's contribution was smaller and total CPI ran at only 2.4% annually. The Iran conflict drove a rapid escalation in gasoline (+18.9% YoY) and fuel oil (+44.2% YoY) prices during Q1 2026.
Food inflation at 2.7% is also notable — running above the core rate — as supply chain pressures and higher transportation/fuel costs are flowing into grocery prices. Core inflation, at 2.6%, remains more controlled, confirming the shock is primarily externally driven rather than reflecting broad domestic demand pressure.
Energy is the dominant CPI driver this month — a complete reversal from February's composition. If energy prices stabilize, headline inflation could moderate. If they persist at current levels, 4%+ CPI readings are plausible by mid-2026.
One-Year Inflation Expectations (University of Michigan)
↗ Source: FRED / University of Michigan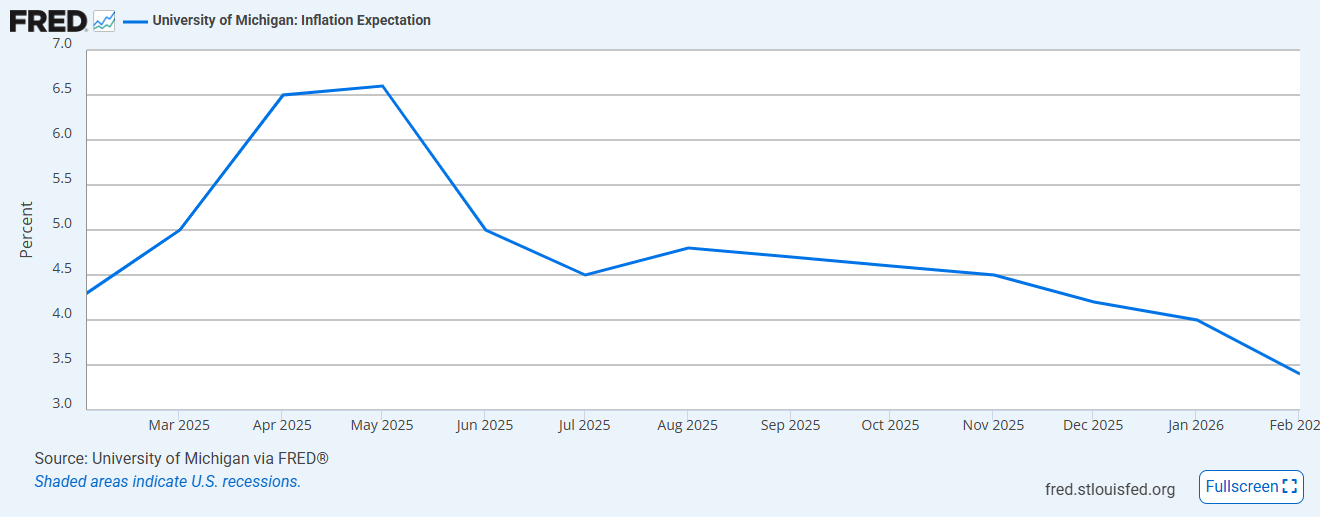
One-year-ahead inflation expectations have surged to 4.8% in April 2026, up from 3.8% in March — the largest single-month jump since April 2025. Long-term (5-year) expectations also rose to 3.4%, the highest since November 2025. (Note: FRED's published value shows 3.4% for February as the source restricts showing the most current reading until formally released; the 4.8% figure comes from the Michigan survey's preliminary April release.)
The de-anchoring of inflation expectations is a serious concern for the Federal Reserve. Once consumers expect high inflation, they change behavior in self-fulfilling ways — demanding higher wages, accepting higher prices, pulling forward purchases — all of which can embed inflation more deeply.
People are expecting inflation to go significantly higher over the next year. At 4.8%, expectations are well above the Fed's 2% target and rising rapidly. This is one of the most alarming readings in this entire dashboard from a monetary policy perspective.
Consumer Sentiment (University of Michigan)
↗ Source: Trading Economics / U of Michigan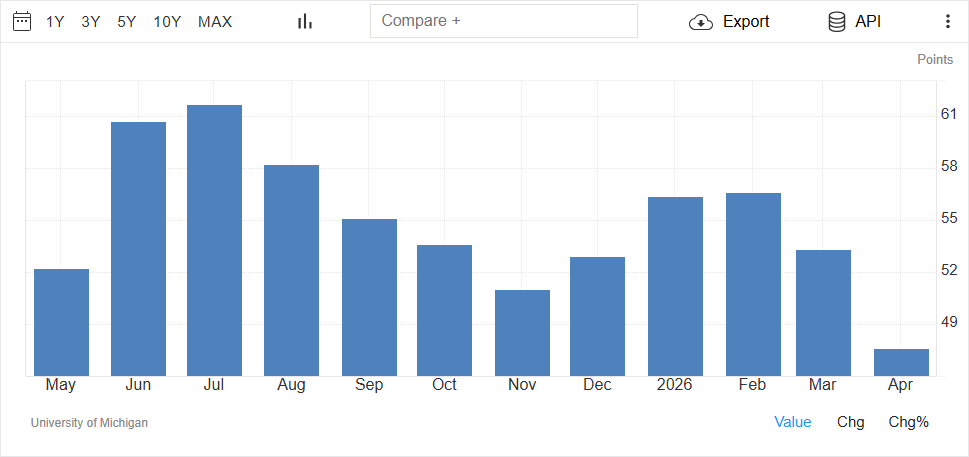
| Period | Consumer Sentiment | Change |
|---|---|---|
| February 2026 | 56.6 | - |
| March 2026 | 53.3 | -3.3 pts |
| April 2026 (Prelim.) | 47.6 | -5.7 pts (-11%) |
| Market Expectation | 52.0 | — |
Consumer sentiment collapsed to a historic low of 47.6 in April 2026, missing expectations of 52 by a wide margin and falling 11% from March's 53.3. The decline was broad-based across all demographic groups and every index component. Critically, 98% of responses were collected before the temporary cease-fire announcement, meaning the reading may not capture any relief from that development. Key drivers: rising prices from the Iran war, shrinking asset values, and deteriorating buying conditions for vehicles and durable goods.
Consumer confidence is in freefall, hitting levels associated with deep recession-era pessimism. This is one of the starkest single-month deteriorations in survey history. Spending behavior will likely follow — the February retail sales strength may soon reverse sharply.
Investor Sentiment (AAII Survey)
↗ Source: AAII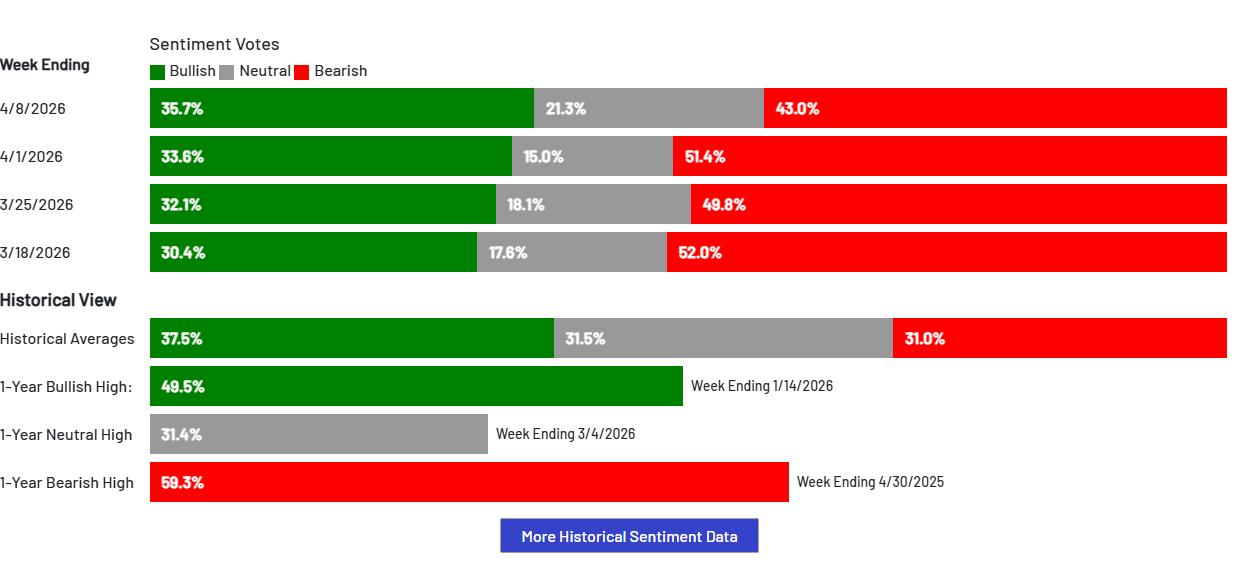
| Week Ending | Bullish | Neutral | Bearish |
|---|---|---|---|
| March 18, 2026 | 30.4% | 17.6% | 52.0% |
| March 25, 2026 | 32.1% | 18.1% | 49.8% |
| April 1, 2026 | 33.6% | 15.0% | 51.4% |
| April 8, 2026 | 35.7% | 21.3% | 43.0% |
| Historical Average | 37.5% | 31.5% | 31.0% |
The AAII survey for the week ending April 8, 2026 shows bearish sentiment at 43.0% — still elevated, but down significantly from 51.4% the prior week. Bullish sentiment rose 2.2 percentage points to 35.7%, still below its 37.5% historical average (8th consecutive week below average). The 1-year bearish high was 59.3% (April 30, 2025), so current levels, while concerning, have not reached last year's extremes. As a contrarian indicator, extreme bearishness historically precedes market recoveries.
Investor pessimism remains elevated but is retreating from its recent peak. Bears still outnumber bulls by 7+ percentage points — well above historical norms. From a contrarian standpoint, the easing of extreme bearish sentiment could signal a potential market bottom forming.
ISM Manufacturing PMI
↗ Source: ISM / Trading Economics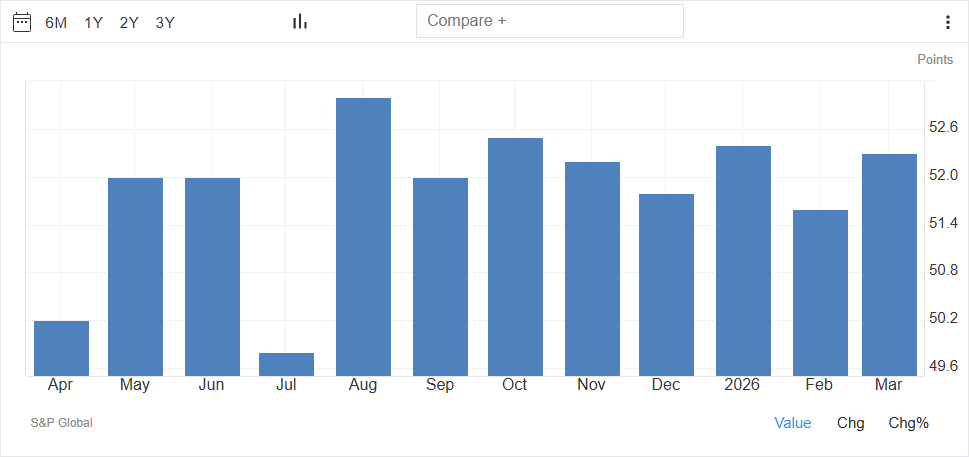
The ISM Manufacturing PMI rose to 52.7 in March 2026, up from 52.4 in February and its highest level since August 2022. Manufacturing is expanding at an impressive pace given the headwinds. However, the Prices Paid index of 78.3 — its highest since June 2022 — is alarming. It signals manufacturers are paying significantly more for inputs, with these costs set to flow through to consumer prices. The Iran war was cited by ~40% of respondents as a new business impact. Supplier deliveries slowed for a fourth consecutive month (58.9), signaling ongoing supply chain stress.
Manufacturing is a rare bright spot — expanding at its best pace in 3.5 years. But the Prices Paid index at 78.3 is a serious inflationary warning buried inside an otherwise positive headline. Employment contraction is also worth watching.
ISM Services PMI
↗ Source: ISM / Trading Economics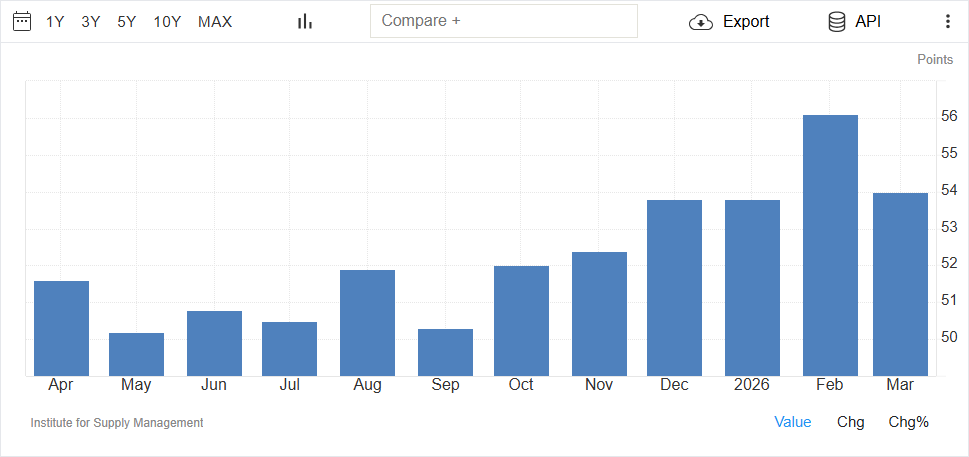
The ISM Services PMI fell to 54.0 in March from 56.1 in February — a notable deceleration, though still firmly in expansion territory. New orders remained robust at 60.6, but employment fell sharply to 45.2 — its first contraction in four months — suggesting services businesses are beginning to pull back on hiring. The Prices index at 70.7 (highest since October 2022) mirrors the manufacturing prices surge and confirms broad inflationary pressure. ISM Chair Steve Miller noted the predominant commentary was about "impacts and adjustments due to the conflict with Iran."
Services remain in expansion but are clearly decelerating. The employment contraction is a leading warning for payroll data — if this persists, non-farm payrolls could soften significantly in April and May reports. Price pressures are intensifying.
Industrial Production
↗ Source: Federal Reserve / FRED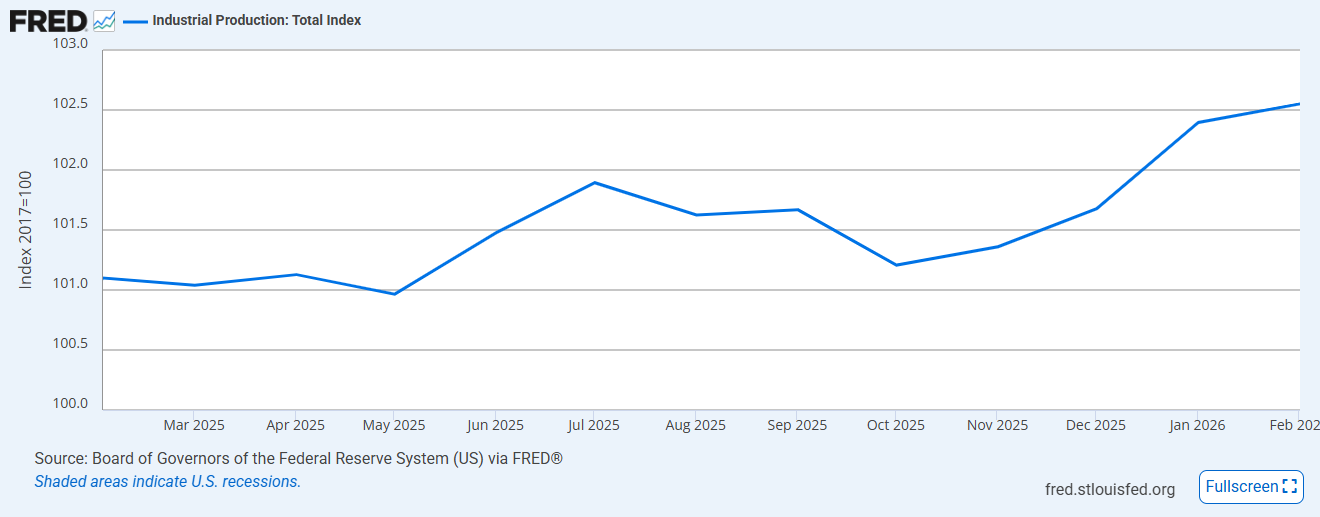
The Federal Reserve's Industrial Production index registered 102.55 in February 2026 (Index 2017=100, seasonally adjusted), covering manufacturing, mining, and electric/gas utilities. The index has been hovering in the 101–103 range over the past year, indicating broadly flat industrial output — consistent with a moderate expansion rather than a boom or contraction. The March reading will be released April 16 and will be closely watched given the Iran war's impact on energy production and manufacturing supply chains.
Industrial production is stable but not accelerating. At 102.55, it tracks below pre-pandemic trend. Forward-looking indicators (ISM prices, supply chain delays) suggest potential headwinds ahead in the March print.
Retail Sales
↗ Source: U.S. Census Bureau / Trading Economics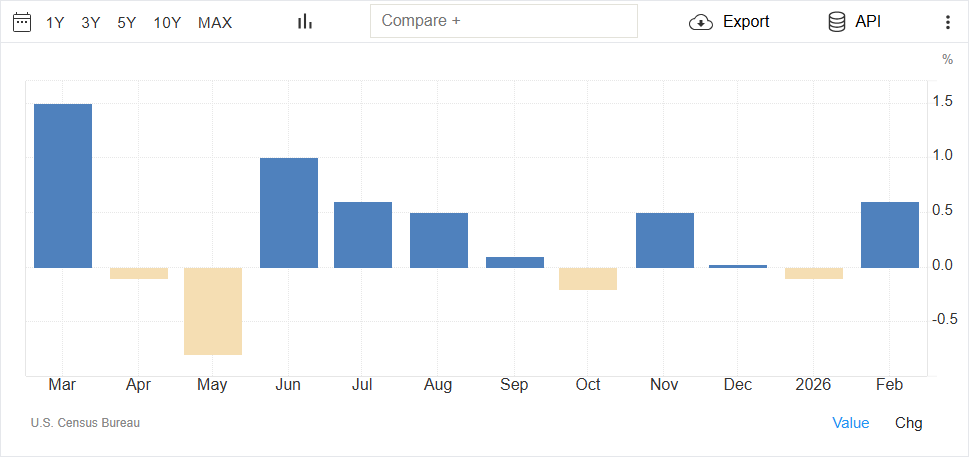
| Category | MoM Change (Feb 2026) |
|---|---|
| Department Stores | +3.0% |
| Health & Personal Care | +2.3% |
| Clothing | +2.0% |
| Sporting Goods & Hobbies | +1.3% |
| Motor Vehicle & Parts Dealers | +1.2% |
| Gasoline Stations | +0.9% (partly price-driven) |
| Food & Beverages | -1.0% |
| Furniture | -1.0% |
February retail sales were impressive across the board. However, the April consumer sentiment crash to 47.6 suggests a sharp reversal in spending may be imminent. Soft data leads hard data by 1–3 months — the March/April retail reports will be critical.
Non-Farm Payrolls
↗ Source: BLS / FRED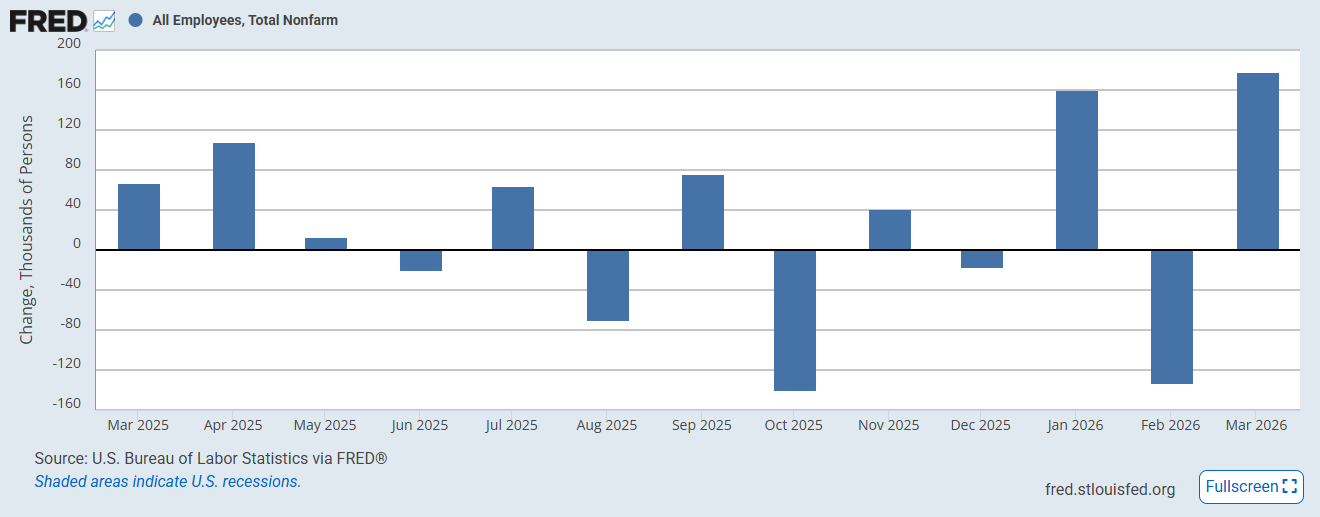
Non-farm payrolls rose by +178,000 in March 2026, representing solid but moderating job growth. The labor market is cooling from its robust 2024–2025 pace but remains above the ~100k/month threshold typically associated with labor market deterioration. The ISM Services employment subindex fell sharply into contraction in March (45.2), which may foreshadow softer payroll numbers in the April and May reports. The unemployment rate ticked up to 4.3% alongside this reading.
The labor market is softening but not breaking. +178k is healthy by any objective measure, but the downward trend is clear. Services sector employment data suggests April's report may come in below 150k — a meaningful deceleration threshold.
Total Vehicle Sales
↗ Source: BEA / FRED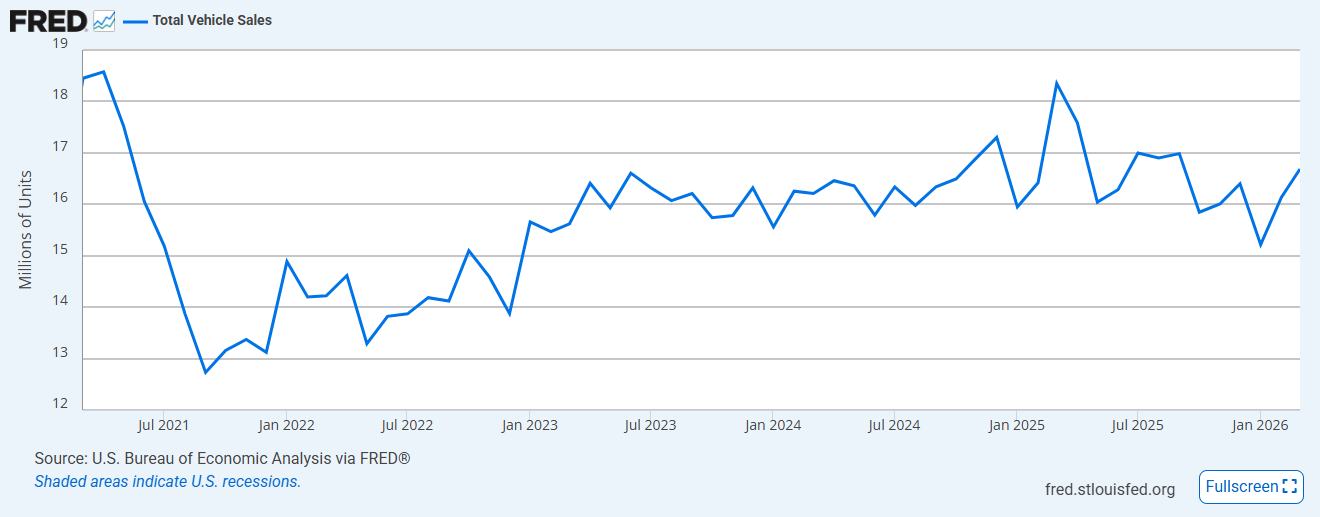
Total vehicle sales surged to 16.686 million units SAAR in March 2026 — a multi-month high. Retail sales data confirmed a +1.2% increase in motor vehicle and parts dealer sales in February. Some of March's strength may reflect consumers pulling forward vehicle purchases ahead of anticipated price increases from Iran war supply chain impacts, higher fuel costs, and potential tariff uncertainty (despite the Supreme Court striking down IEEPA tariffs in March). This "pull-forward" dynamic could leave the April–May auto numbers soft by comparison.
Vehicle sales are robust at 16.7 million units, improving from both last month and last quarter. However, the strength may partially reflect demand pull-forward. With consumer confidence at historic lows, sustainable strength going into Q2 is questionable.
Manheim Used Vehicle Value Index
↗ Source: Manheim Consulting / Moody's Analytics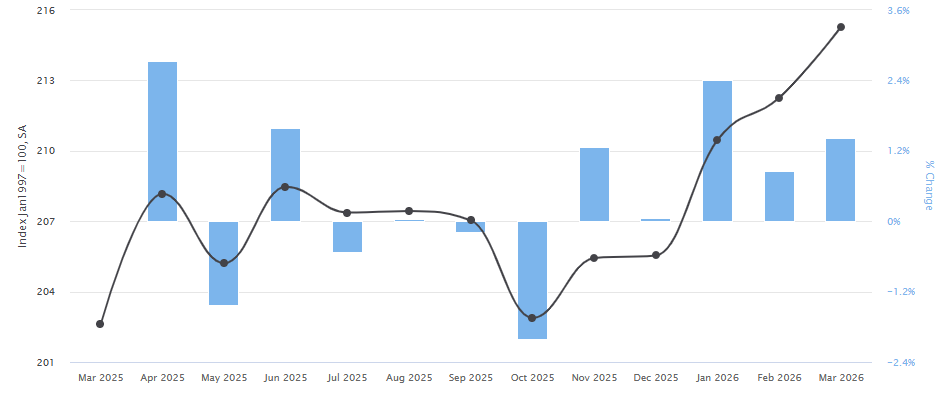
The Manheim Used Vehicle Value Index rose to 215.28 in March 2026, up from 212.27 in February — a monthly increase of +1.42%. Used vehicle prices have been climbing steadily due to: (1) strong consumer demand for used vehicles as an alternative to expensive new models, (2) supply chain constraints limiting new vehicle inventory, and (3) higher transportation and fuel costs embedded in dealer pricing. The upward trend is inflationary for the used vehicle and transportation components of CPI.
Used car prices are trending higher and adding upward pressure to CPI's transportation component. The index has risen consistently in recent months and is well above 2024 levels, reinforcing the broad-based inflationary narrative.
US New Home Sales (Monthly Supply)
↗ Source: U.S. Census Bureau / FRED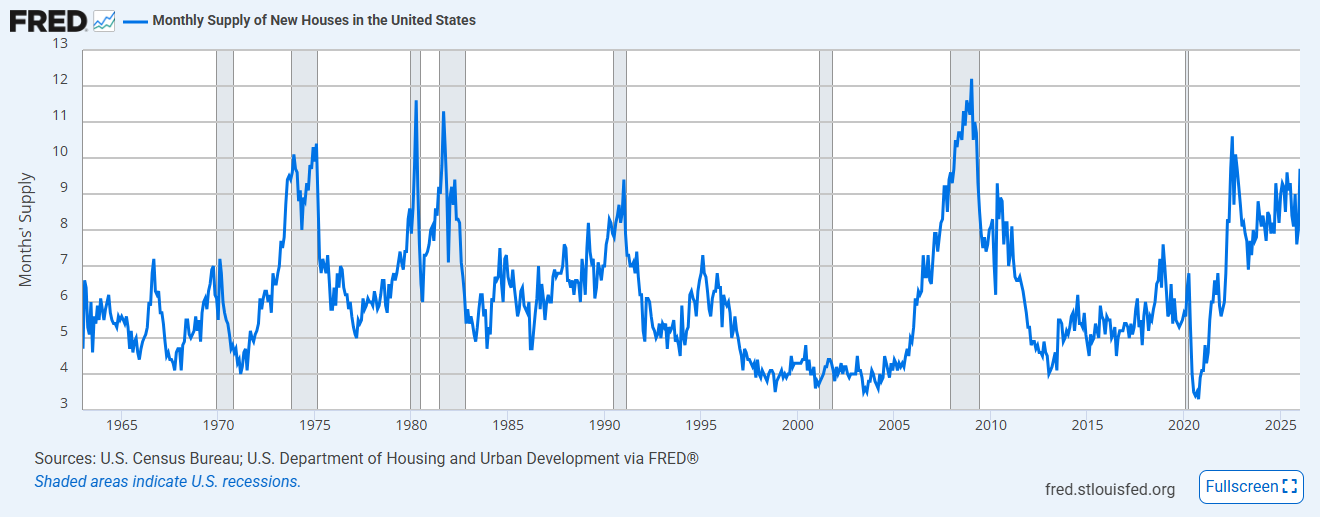
The monthly supply of new homes stands at 9.7 months as of January 2026 — well above the 6-month level considered balanced between buyers and sellers. This elevated inventory reflects the ongoing impact of high mortgage rates (6.37%) constraining affordability, even as builders continued adding units throughout 2025. With consumer sentiment at historic lows and financing costs still elevated, demand for new homes is under significant pressure. The supply overhang provides little incentive for new construction starts.
New home inventory remains at nearly twice the balanced level. High rates and poor sentiment are crushing buyer activity. The housing market remains deeply depressed, with little catalyst for improvement unless mortgage rates fall substantially below 6%.
30-Year Fixed Mortgage Rate
↗ Source: Freddie Mac / FRED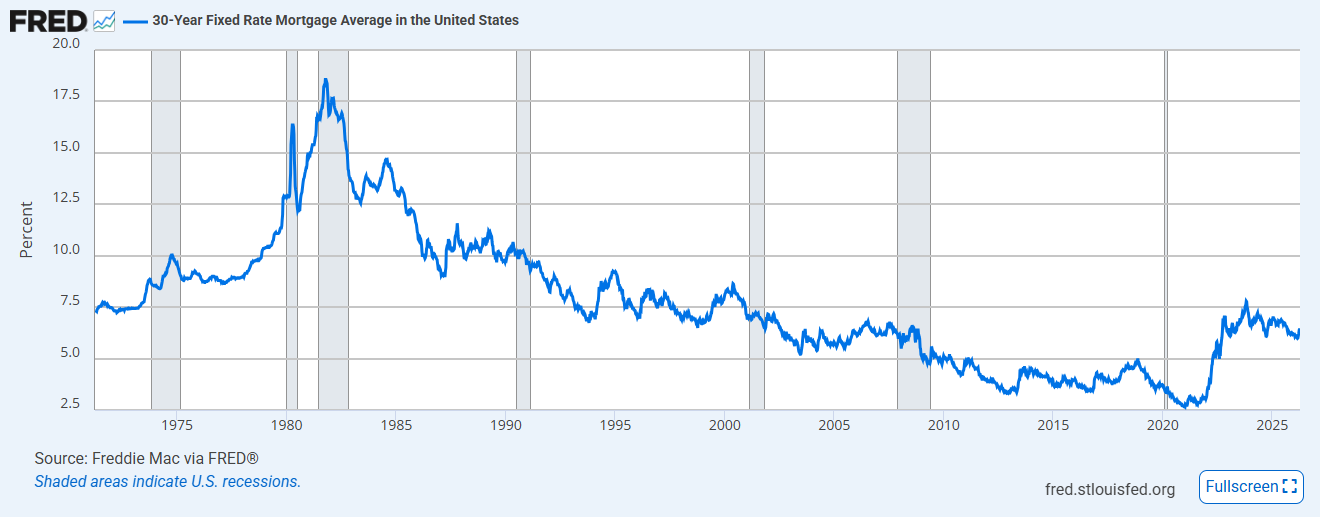
The 30-year fixed mortgage rate averaged 6.37% for the week ending April 9, 2026 — down modestly from ~6.5–6.6% in March and ~6.8–6.9% in January. The gradual decline is being driven by a flight to U.S. Treasuries amid geopolitical uncertainty, which has pushed long-term yields down and, with them, mortgage rates. At 6.37%, rates remain well above the ~5% level that most housing economists cite as necessary for meaningful demand reactivation. Affordability remains severely constrained — the monthly payment on a median-priced home has risen dramatically versus 2020–2021 norms.
Mortgage rates are edging lower to 6.37% — providing modest relief but still at historically punishing levels for home buyers. Housing affordability remains the worst in a generation. Meaningful recovery requires rates in the 5–5.5% range, which would require significant Fed easing.
Unemployment Rate
↗ Source: BLS / FRED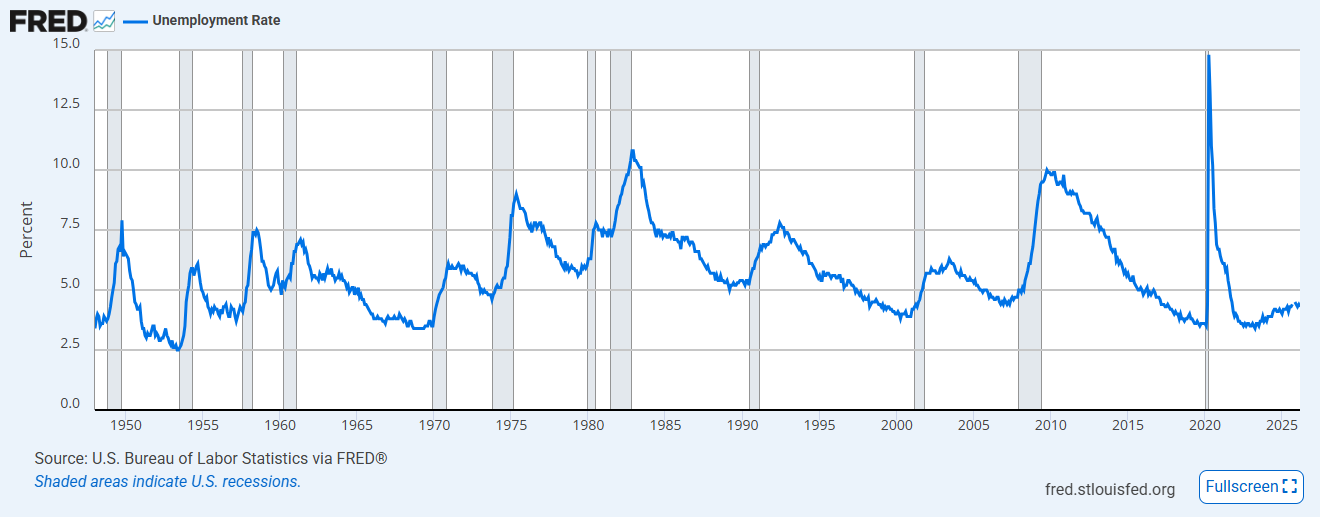
The U.S. unemployment rate rose to 4.3% in March 2026, up from ~4.2% in February and ~4.1% in January. The trend is one of gradual upward drift — not a sharp spike — consistent with a cooling labor market rather than a recessionary breakdown. Compared to one quarter ago (~4.0–4.1% in Q4 2025), the rate has risen approximately 0.2–0.3 percentage points. If payroll growth continues to decelerate below 150k/month and the services employment contraction seen in ISM data persists, the rate could accelerate toward 4.5–4.7% by mid-2026.
Unemployment is rising gradually but has not broken down. At 4.3%, it remains near historically low levels. The direction of travel — upward — combined with deteriorating leading indicators warrants close attention. A move above 4.5% would significantly raise recession risk assessments.
Jobless Claims
↗ Source: DOL / Trading Economics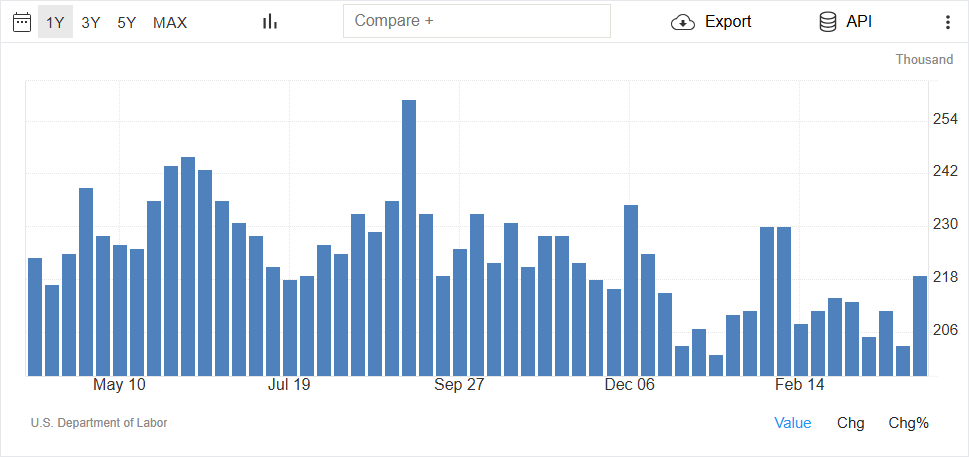
| Reference Period | Initial Claims | vs. Consensus | Signal |
|---|---|---|---|
| Week ending Jan 3, 2026 | ~201K | — | 2-Year Low |
| Q1 2026 avg (est.) | ~207K | — | Healthy |
| Week ending Mar 28, 2026 | 202K | Beat (212K exp.) | Very Low |
| Week ending Apr 4, 2026 | 219K ↑ | Missed (212K exp.) | Uptick |
Initial jobless claims rose by 16,000 to 219,000 for the week ending April 4, 2026 — the largest single-week count in a month, coming in above the market consensus of 212,000. However, context is critical: this follows a near two-year low of 201,000–202,000 in late March, and the 219,000 reading still remains firmly below the averages seen in the second half of 2025 (which ran in the 230–250k range). The week-to-week move is noise, not a trend break.
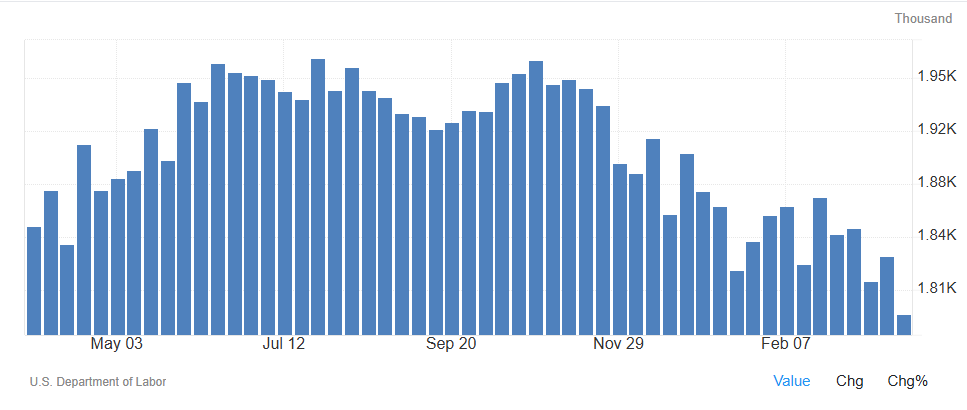
More encouragingly, continuing claims dropped 38,000 to 1,794,000 — the lowest level in nearly two years. This metric, which proxies for how long laid-off workers remain unemployed, signals a robust hiring environment where workers are finding new jobs quickly. Low continuing claims reflect low net firing even as payroll growth moderates.
The labor market remains fundamentally healthy. The uptick in initial claims to 219k is notable but not alarming — it follows an exceptionally low prior week. Continuing claims at a near 2-year low of 1,794k are the more important signal: once laid off, workers are being re-employed quickly. Watch for sustained claims above 250k as the threshold for labor market deterioration.
Yield Curve (10Y–2Y Spread)
↗ Source: U.S. Treasury / FREDThe 10-year minus 2-year Treasury yield spread stands at +0.50% as of April 10, 2026 — comfortably positive, meaning the yield curve is no longer inverted. This is a significant development: the curve spent much of 2022–2024 deeply inverted (as low as -1.07%), which historically has been one of the most reliable leading indicators of recession.
The curve has been re-steepening over the past year, moving from near-zero or slightly negative territory in early 2025 to now +0.50%. The steepening has been driven by:
- Short-term rates falling as markets price in eventual Fed rate cuts amid slowing growth
- Long-term rates staying elevated (or rising) on inflation concerns from the Iran energy shock
- A geopolitical flight to short-duration Treasuries driving 2-year yields down faster than 10-year yields
Compared to one month ago (~+0.20–0.35%), the curve has steepened meaningfully. Compared to one quarter ago (near zero), the move to +0.50% is substantial. Historically, yield curve re-steepening after a period of inversion can precede recession — the "un-inversion" often signals the economic slowdown is already arriving rather than being averted.
The yield curve at +0.50% is no longer flashing the inversion warning — but the manner of un-inversion (short rates falling on growth fears rather than long rates falling) is not necessarily reassuring. This is "bear steepening" territory, consistent with stagflationary dynamics. The curve has moved from a recession warning signal to a "growth slowdown materializing" signal.
High Yield OAS Spread
↗ Source: ICE BofA / FRED| Spread Level | Market Interpretation |
|---|---|
| < 3.0% | Tight — Low credit risk priced in, risk-on environment |
| 3.0% – 5.0% | Normal — Moderate credit risk |
| 5.0% – 8.0% | Elevated — Recession risk rising, credit stress |
| > 8.0% | Crisis-level — Severe financial stress (GFC, COVID-level) |
| Current: 2.90% | Tight — Corporate bond market calm despite macro headwinds |
The ICE BofA US High Yield Option-Adjusted Spread (OAS) stands at 2.90% as of April 9, 2026 — historically tight territory. This means high-yield (junk) bonds are yielding only 2.90 percentage points more than equivalent-maturity U.S. Treasuries, suggesting that credit markets are not pricing in significant default or recession risk despite the deterioration in macro sentiment indicators.
The spread has edged slightly wider compared to one quarter ago (~2.50–2.80% in January 2026) as the geopolitical situation introduces modest uncertainty into credit markets. However, at 2.90% it remains well below the 5%+ levels typically associated with recession stress and far below crisis-level spreads seen during COVID (10%+) or the GFC (20%+).
The disconnect between tight credit spreads and collapsing consumer/investor sentiment is a critical tension in the current environment. Either: (a) credit markets are right and the economy will prove more resilient than soft data suggests, or (b) credit markets are complacent and spreads will widen sharply once hard data deteriorates.
At 2.90%, HY spreads remain historically tight and are not signaling imminent credit distress or recession. This is an important counterweight to the negative sentiment data — corporate bond markets are calm. However, spreads have widened slightly from their January lows, and a move above 4–5% would be a serious warning signal to watch.
CBOE Equity Put/Call Ratio
↗ Source: CBOE / YCharts| Ratio Level | Interpretation |
|---|---|
| < 0.60 | Bullish — More calls than puts, risk appetite high |
| 0.60 – 0.80 | Neutral — Balanced options positioning |
| > 0.80 | Bearish/Fear — More puts than calls, hedging demand elevated |
| Current: 0.51 | Bullish — Options market signaling risk appetite recovery |
The CBOE Equity Put/Call Ratio stands at 0.51 as of April 10, 2026 — well below the 0.80 threshold that signals elevated fear and hedging demand. A ratio below 0.60 indicates investors are buying more calls (upside bets) than puts (downside protection), reflecting risk appetite rather than defensive positioning.
The current 0.51 reading is down sharply from the fear peaks of mid-March 2026, when the ratio spiked to 0.86–0.90 as geopolitical uncertainty peaked around the Iran conflict escalation. More recently, even as the conflict continued, options markets calmed significantly — a possible sign of capitulation or the effect of the temporary cease-fire. There was a brief spike to 0.72 on April 7 before settling back to 0.51 on April 10.
Compared to one month ago (mid-March peak: 0.86–0.90), today's 0.51 represents a major reversal in options market sentiment. Compared to one quarter ago (January: 0.52–0.65), the ratio is at the low end of that range, suggesting bullish positioning comparable to early 2026 optimism.
At 0.51, the put/call ratio signals options market participants are positioned for upside, not hedging against further downside. This is a notable divergence from the bearish AAII survey and collapsing consumer sentiment — options traders appear more optimistic than survey respondents. As a contrarian indicator, a very low put/call ratio can sometimes signal complacency and precede market pullbacks.
S&P 500 Valuation & Earnings
↗ Source: FactSet Earnings Insight (Apr 10, 2026)| Quarter | Estimated EPS Growth (YoY) | Signal |
|---|---|---|
| Q1 2026 (current est.) | +12.6% | 6th Straight Double-Digit Qtr |
| Q1 2026 (Dec 31 est.) | +12.9% | Revised Slightly Lower |
| Negative EPS Guidance (Q1) | 51 companies | Caution |
| Positive EPS Guidance (Q1) | 58 companies | More Positive Than Negative |
The S&P 500's forward 12-month P/E ratio stands at 20.4x as of April 10, 2026, according to FactSet's Earnings Insight report. This is above both the 5-year average of 19.9x and the 10-year average of 18.3x, indicating the market is trading at a premium to historical norms — expensive by traditional valuation metrics.
Q1 2026 Earnings Season (Early Results): With only 4% of S&P 500 companies having reported actual Q1 results, early signs are encouraging: 80% have beaten EPS estimates and 90% have beaten revenue estimates. The estimated Q1 2026 earnings growth rate stands at +12.6% year-over-year — which, if it holds, would mark the sixth consecutive quarter of double-digit earnings growth for the index.
Revisions: The Q1 2026 earnings growth estimate started the year at 12.9% (December 31, 2025) and has been modestly revised lower to 12.6%, with 9 sectors expected to report lower earnings versus the December estimate. The downward revisions are modest but reflect emerging headwinds from the Iran conflict on energy costs, supply chains, and business confidence.
Earnings Guidance: For Q1 2026, 58 companies issued positive EPS guidance versus 51 issuing negative guidance — a net positive tilt, suggesting corporate management teams are more optimistic than pessimistic about near-term prospects, despite the macro headwinds.
The S&P 500 trades at a premium valuation of 20.4x forward earnings — above both historical averages. Earnings growth of ~12.6% in Q1 provides justification for some premium, and early beat rates are strong. However, a 20.4x multiple combined with slowing GDP (1.3%), re-accelerating inflation (3.3%), and collapsing consumer sentiment creates a valuation risk: if earnings growth decelerates or misses estimates in Q2–Q3 2026, the market could face a meaningful multiple compression event.
Executive Summary: The Big Picture
The April 2026 macroeconomic landscape presents a stagflationary challenge — slowing growth combined with re-accelerating inflation — largely triggered by the Iran geopolitical conflict and its cascading effects through energy markets, supply chains, and consumer psychology.
| Indicator | Reading | Trend | Signal |
|---|---|---|---|
| GDP Nowcast (Atlanta Fed) | 1.3% SAAR Q1 2026 | ↓ Decelerating | Caution |
| Conference Board LEI | 97.5 · No recession signal | ↓ Declining | Caution |
| US Dollar (DXY) | 98.49 · Below 100 | ↓ Weakening | Stress |
| GSCI Commodities | 704.67 · +34% YoY | ↑ Surging | Inflationary |
| Gold | $4,771 · Near record | ↑ Surging | Fear/Hedge |
| Bitcoin | $73,630 | → Recovering | Volatile |
| CPI Inflation (Headline) | +3.3% YoY Mar 2026 | ↑ Accelerating | Hot |
| PPI | +3.4% YoY · Feb 2026 | ↑ Rising | Pipeline Hot |
| 1-Yr Inflation Expectations | 4.8% · Apr 2026 | ↑ Surging | De-anchoring |
| Consumer Sentiment (UoM) | 47.6 · Historic low | ↓ Collapsing | Alarm |
| AAII Investor Sentiment | 35.7% Bull / 43.0% Bear | ↑ Fear easing | Elevated Fear |
| ISM Manufacturing PMI | 52.7 · Prices at 78.3 | ↑ Expanding | Resilient |
| ISM Services PMI | 54.0 · Employment 45.2 | ↓ Decelerating | Expanding |
| Industrial Production | 102.55 (Feb 2026) | → Stable | Flat |
| Retail Sales MoM | +0.6% (Feb 2026) | ↑ Strong Feb | Resilient |
| Non-Farm Payrolls | +178k (Mar 2026) | ↓ Cooling | Moderating |
| Total Vehicle Sales | 16.69M SAAR (Mar 2026) | ↑ Strong | Strong |
| Manheim Used Car Index | 215.28 · +1.42% MoM | ↑ Rising | Inflationary |
| New Home Supply | 9.7 months (Jan 2026) | ↑ Elevated | Soft Demand |
| 30-Year Mortgage Rate | 6.37% · Apr 9, 2026 | ↓ Easing slightly | Restrictive |
| Unemployment Rate | 4.3% (Mar 2026) | ↑ Rising gently | Softening |
| Initial Jobless Claims | 219K (wk Apr 4) · Continuing 1,794K | ↑ Uptick but continuing near 2-yr low | Resilient |
| Yield Curve (10Y–2Y) | +0.50% · Apr 10, 2026 | ↑ Steepening, un-inverted | Normalized |
| High Yield OAS Spread | 2.90% · Apr 9, 2026 | → Slight widening from Jan lows | Credit Calm |
| Put/Call Ratio (CBOE) | 0.51 · Apr 10, 2026 | ↓ Down from 0.90 mid-March peak | Risk-On |
| S&P 500 Forward P/E | 20.4x · Q1 EPS growth +12.6% | → Above historical averages | Elevated |