Economic Updates for December 2023
Summary
Market Dynamics: Attaining the Soft Landing, Euphoria, and Emerging Concerns
As the main highlight for this month, the Federal Reserve expressed confidence in achieving a soft landing, leading to a significant rally in various risk assets. The 10-year yield continued its descent and the broadening market rally of November got another boost.
Looking at the recent economic data, outside of the manufacturing PMI and Industrial Production data, the economy is doing well and looks stable. Consumer sentiment popped this month following a slump over the last few months. While this could be attributed to the Santa rally or December shopping season, it will be interesting to see how it changes in the new year.
With VIX reading close to single digit, the euphoria in the financial markets is picture perfect. Come next year, investors will focus on the longer term, year-end elections, government shutdowns, etc. and the wall of worry will mount. There is also news about rising chapter 11 bankruptcy filings, and the rising government debt to GDP ratio which may once again bring additional volatility into the markets.
Broad Indicators
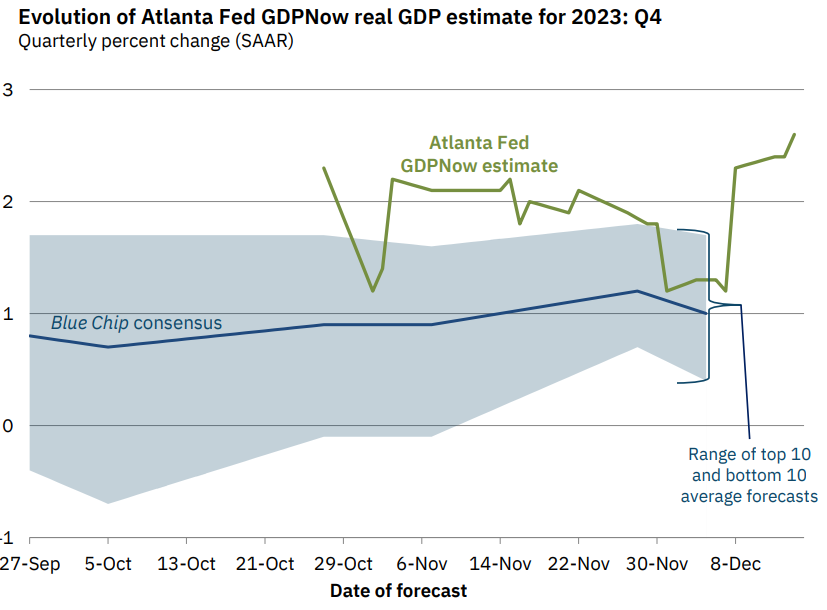
Atlanta GDP NowCast
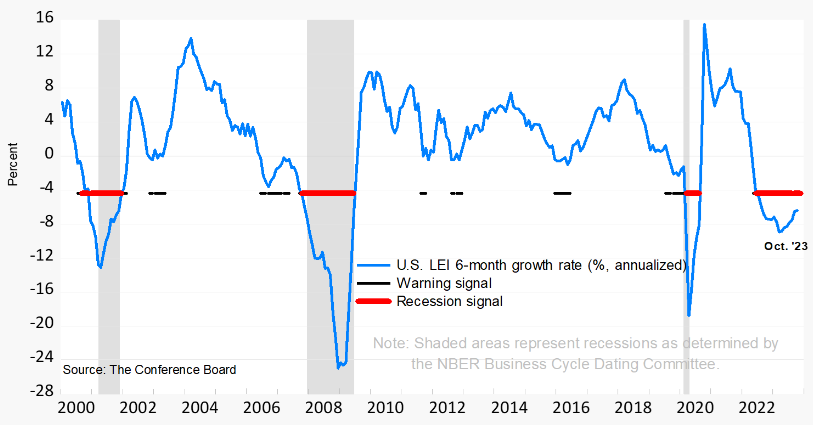
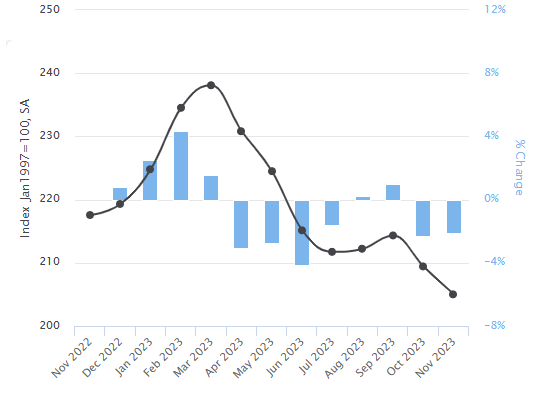
Conference Board's Leading Economic Indicator
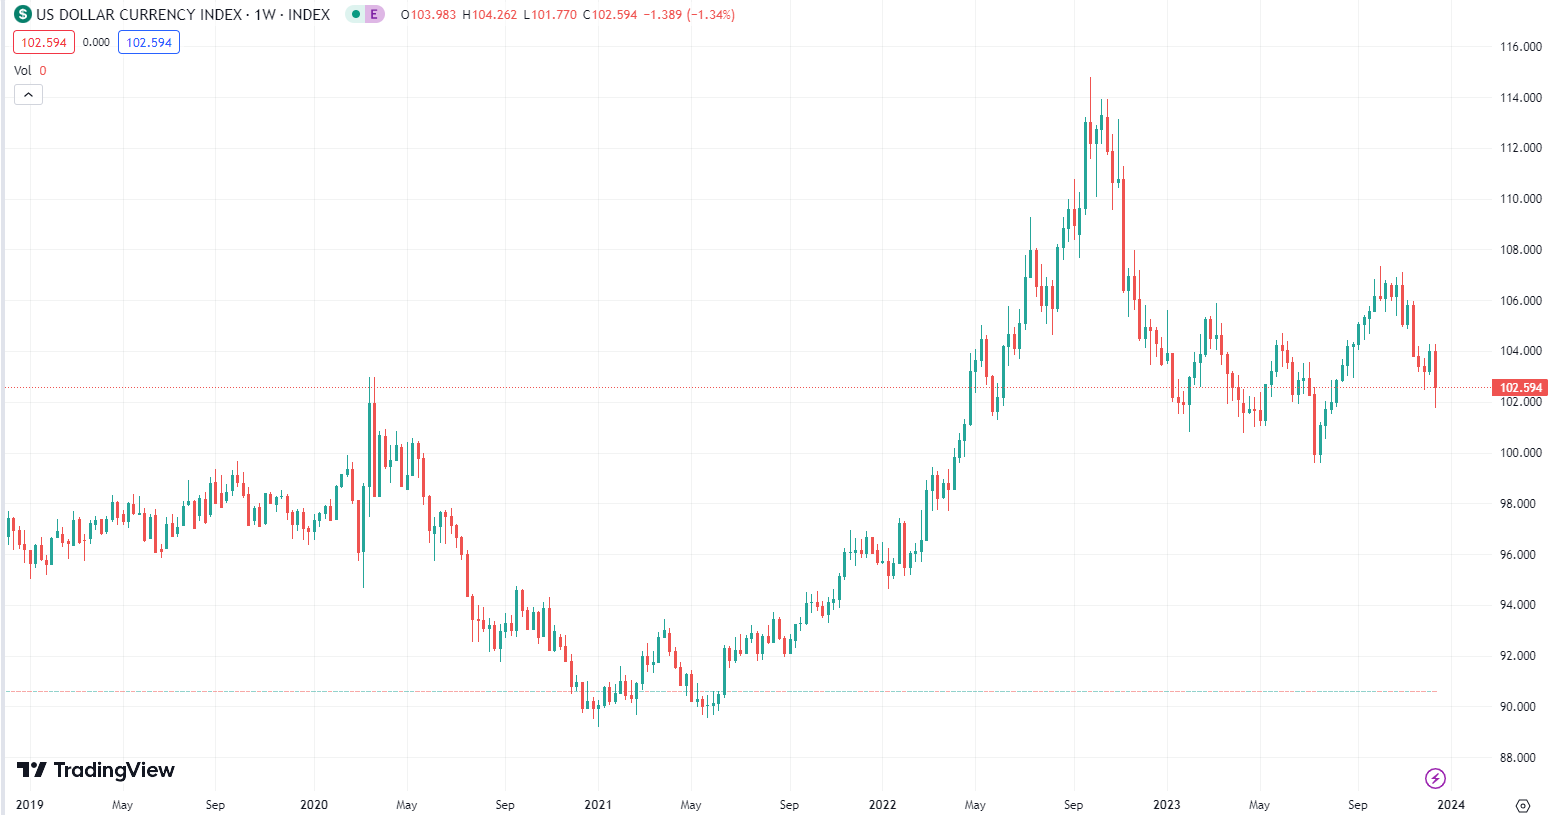
US Dollar Index
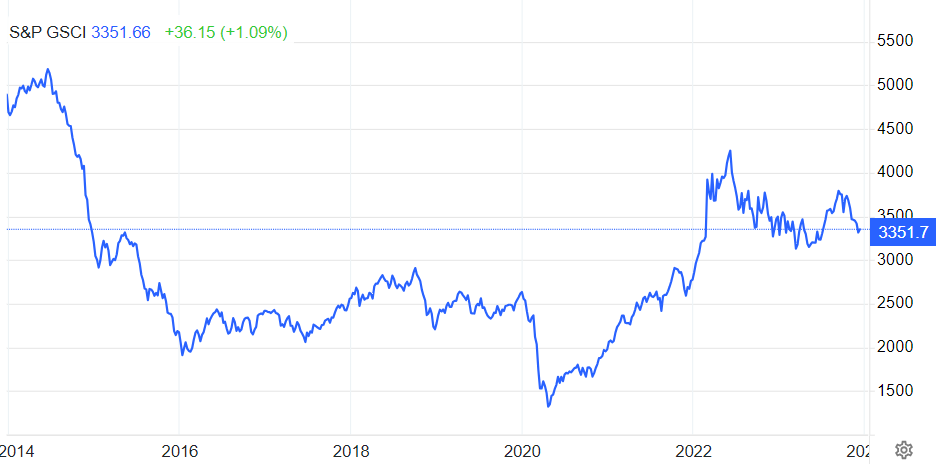
Commodities
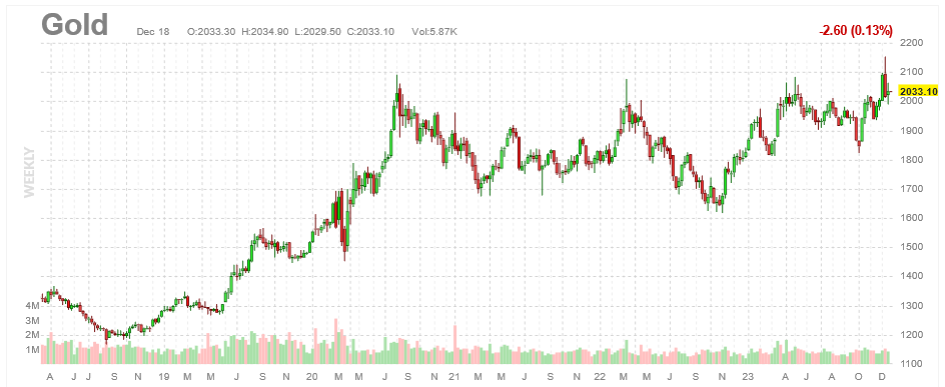
Gold
Bitcoin

Inflation
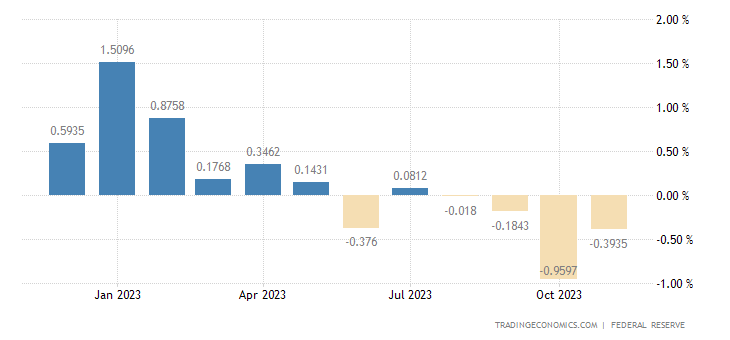
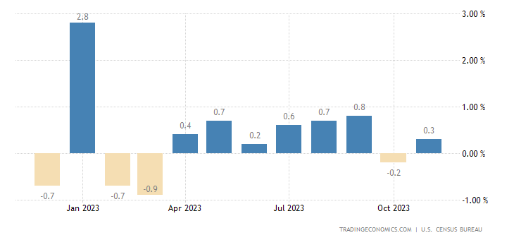
CPI Month over Month
PPI Month over Month
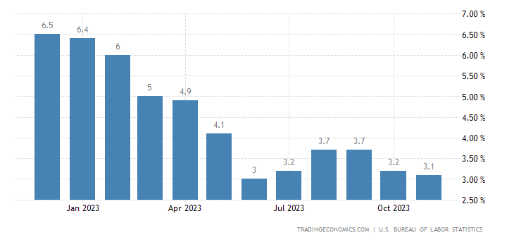
Reported Year over Year Inflation Rate
CPI Components
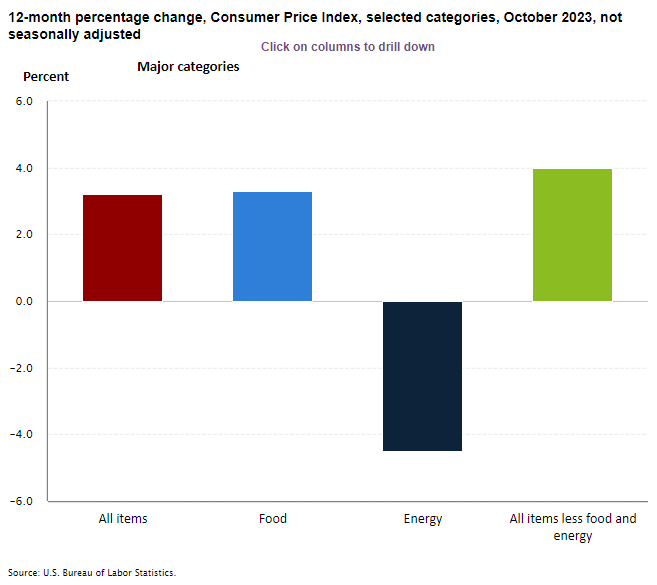 CPI Components Last Month
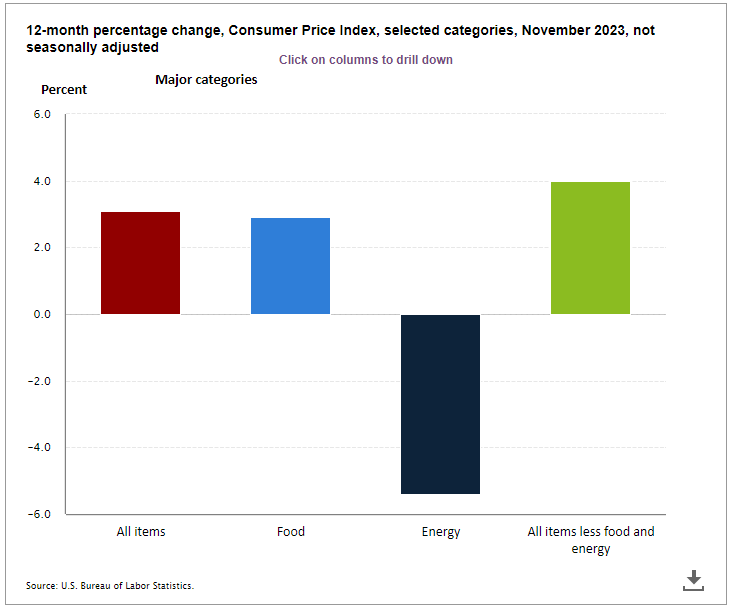 CPI Components This Month
Energy prices have stayed down this month again. You can see that as energy's contribution to reducing inflation is more pronounced this month. (Please note that the y-axis in both the graphs have different scales).
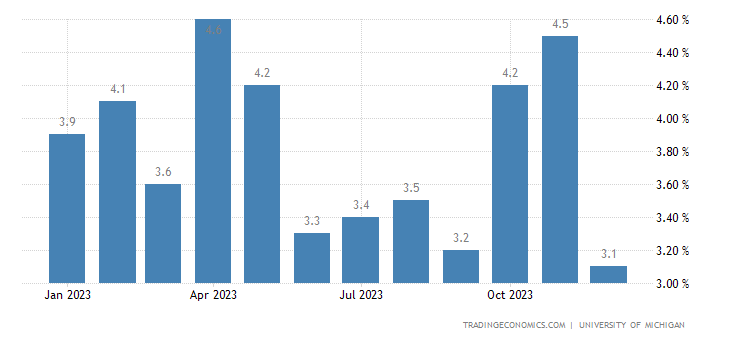
One Year Inflation Expectations
Sentiments
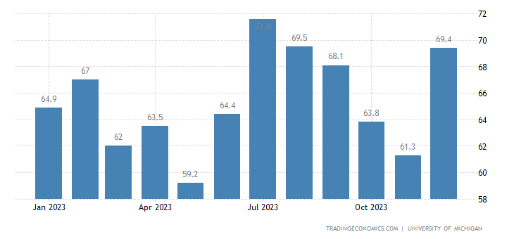
Consumer Sentiments
Investor Sentiments
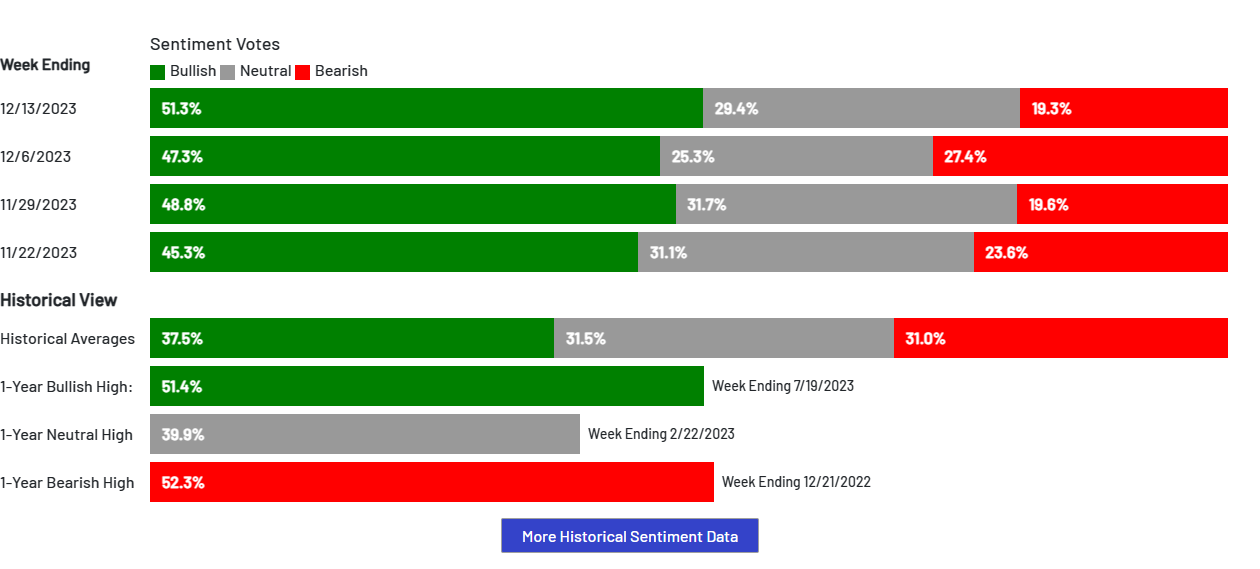
The AAII sentiment has turned very bullish as the S&P 500 has been going higher in the past few days following the FED dovish pivot.
GDP Factors
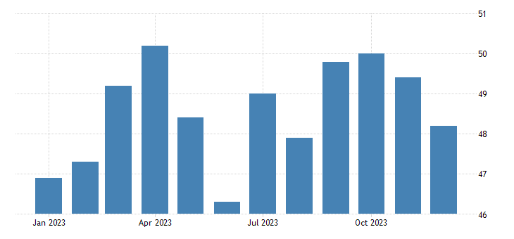
Manufacturing PMI
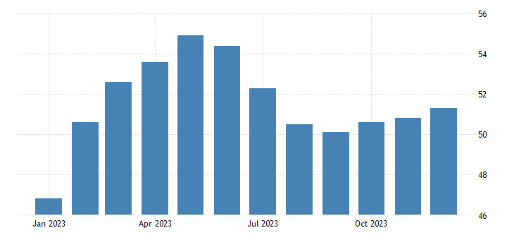
Services PMI
Industrial Production
Retail Sales
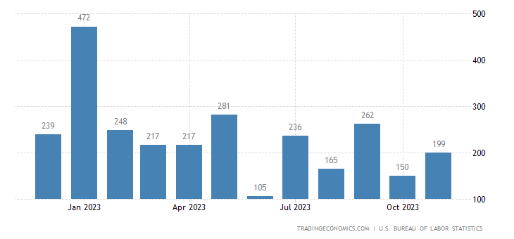
Non-farm Payrolls
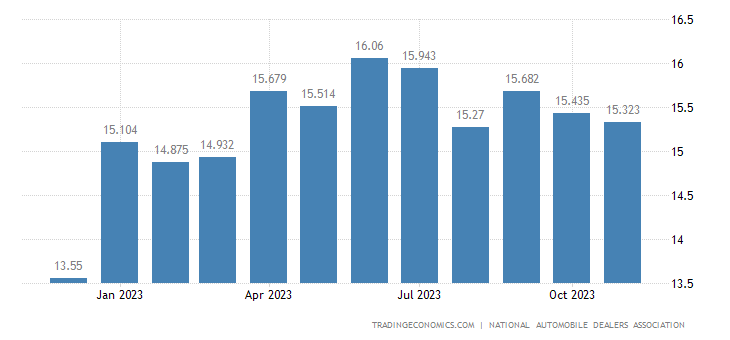
Total Vehicle Sales
Manheim Used Car Index
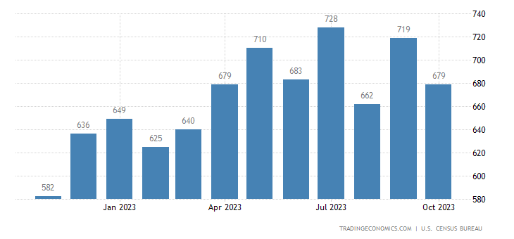
US New Home Sales
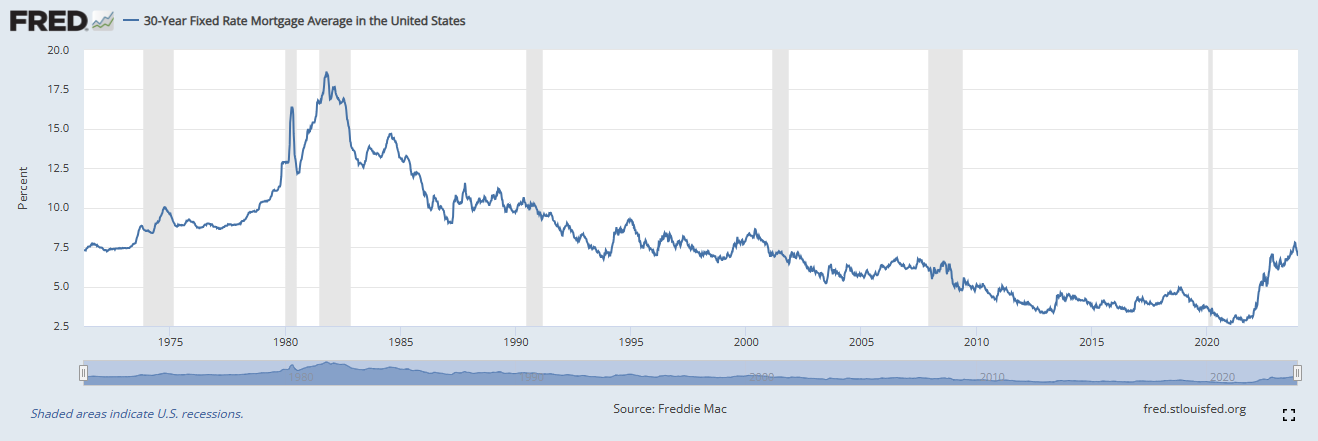
30 Year Fixed Mortgage Rates
The mortgage rates have followed the 10-year Treasury yield higher over the last few months. Recently as the inflation is contained and 10-year Treasury yield has rolled over, the mortgage rates has come down a tad bit.
Employment Indicators
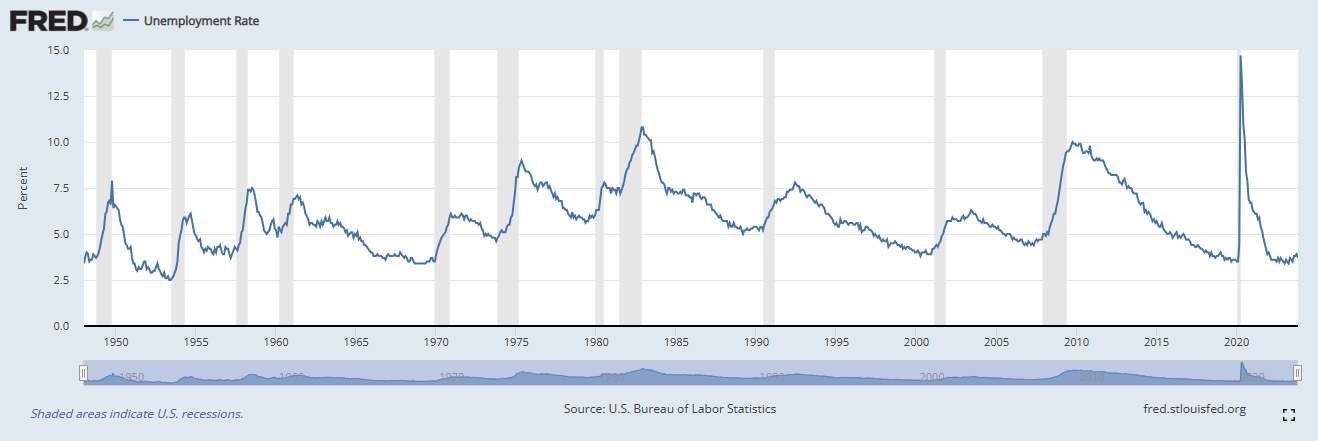
Historical Unemployment Rate
US Jobless Claims
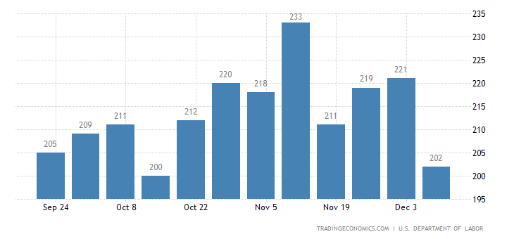
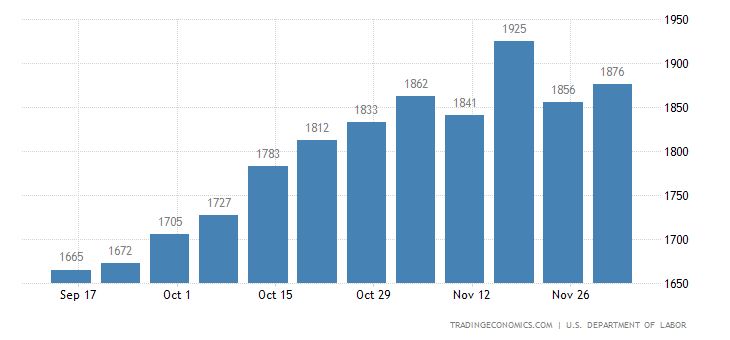 This chart will be the first indicator of a telltale sign that unemployment is increasing. As you see the continuing
jobless claims number rise, it implies the people who lost their jobs are not going back to labor force fast enough
and the unemployment rate is starting to creep higher. Over the last couple of weeks, it has trended higher, indicating
a softening job market. It could turn out to be seasonal and it needs to be watched over the next few months if the continuing
claims build up.
This chart will be the first indicator of a telltale sign that unemployment is increasing. As you see the continuing
jobless claims number rise, it implies the people who lost their jobs are not going back to labor force fast enough
and the unemployment rate is starting to creep higher. Over the last couple of weeks, it has trended higher, indicating
a softening job market. It could turn out to be seasonal and it needs to be watched over the next few months if the continuing
claims build up.
Wage Growth Tracker
Market Indicators
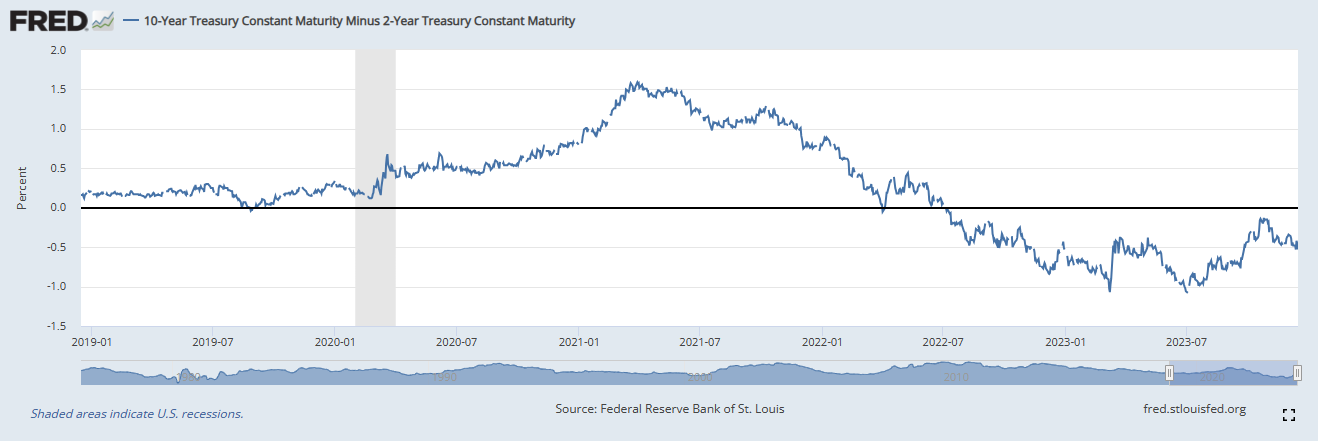
Yield Curve Inversion
Yield Curve - then and now
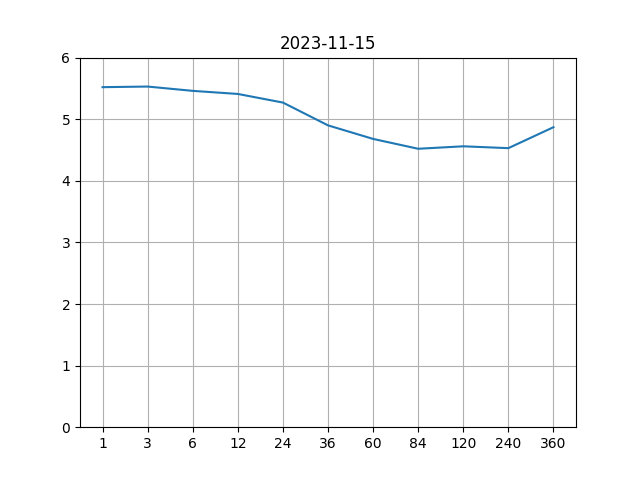 Yield curve - Then
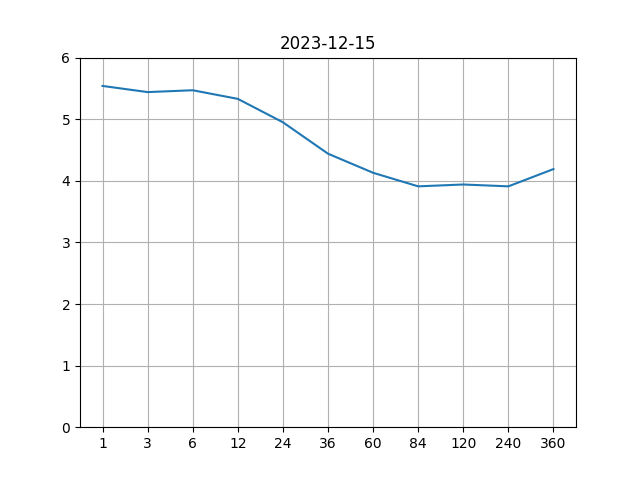 Yield curve - Now
 Notice how the long end of the curve has shited down a bit. This has supported the bond and equity markets alike this month.
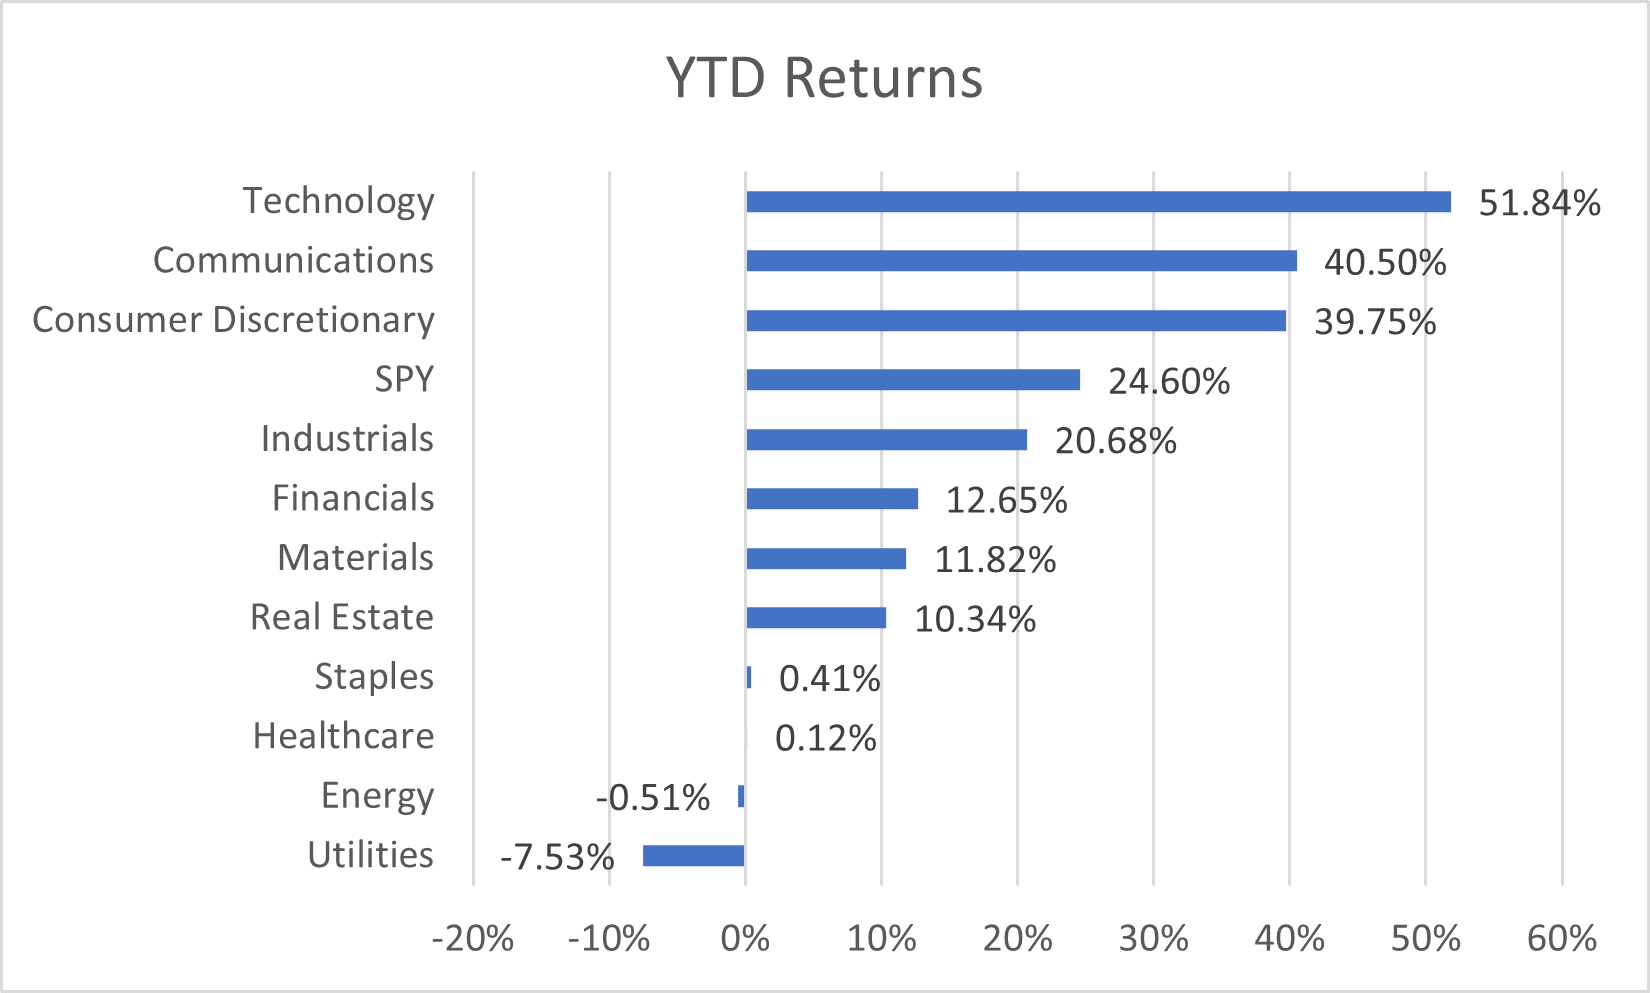
Market Sectors
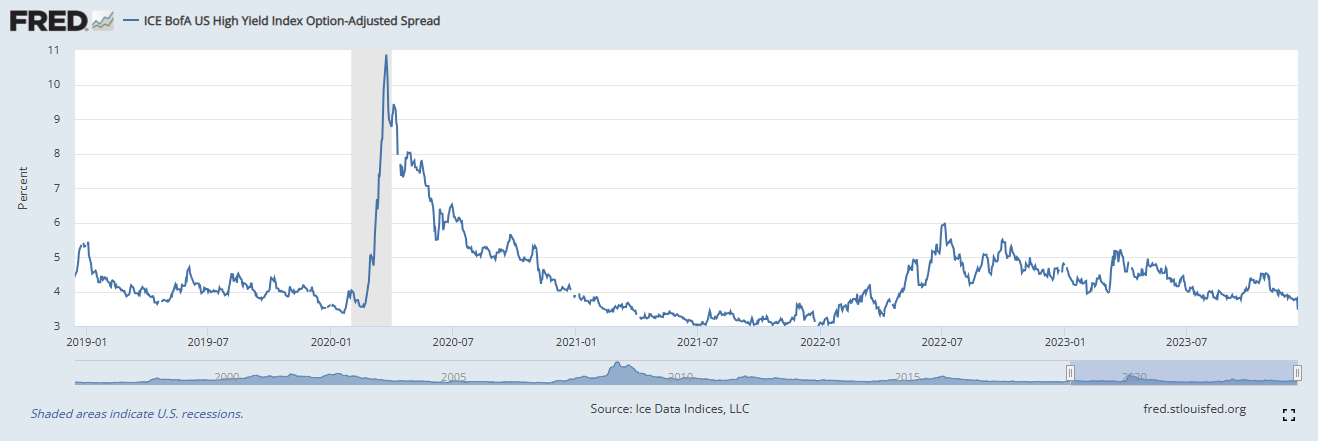
High Yield Index Options-Adjusted Spread
If the economy were to enter a recession, it is likely that some of the companies will struggle to keep up with their debt payments causing their credit spread to widen. This indicator shows how the credit spreads have been behaving so far.
The spreads have tightened by another 40 basis points or so after the FED dovish pivot last week. This may be a good indication that the soft landing narrative is actually playing out.
Put Call Ratio
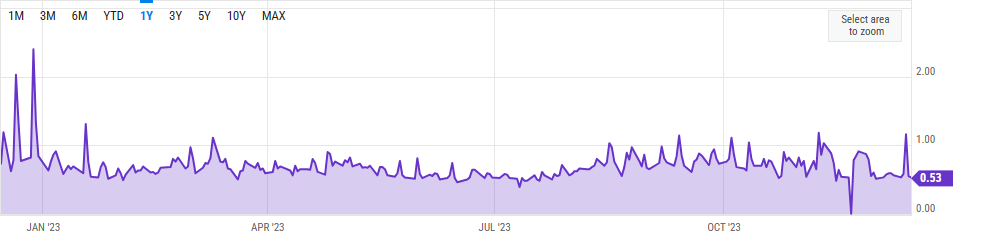
A spike in put / call ratio indicates that investors are very apprehensive about a sudden fall in the equity markets. In October/November, we have seen some interesting activities but nothing out of the ordinary. Recently, as the inflation number came out better than expected, this has led to a short covering rally in bond and equity markets.
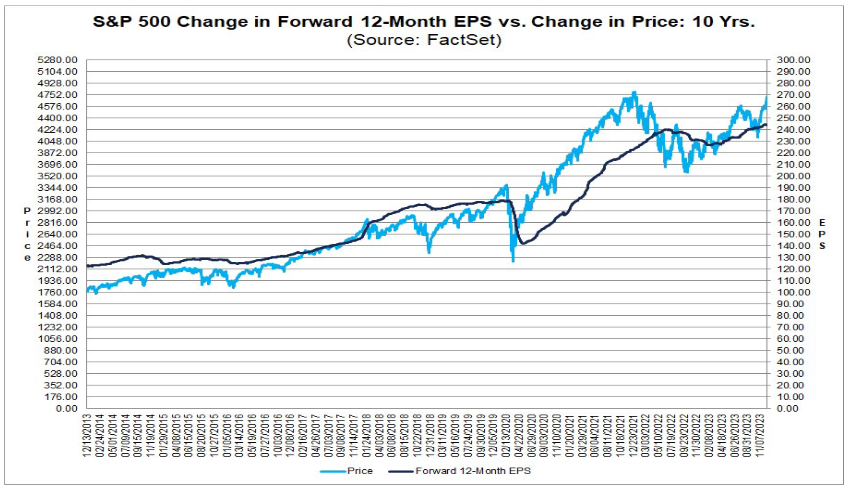
S&P 500 Current Valuations
The current earnings forecast by equity analysts estimate the earnings potential for S&P 500 companies to be around $245 which translates to a price to earnings ratio of 19.3 at the current S&P 500 price level. This is above the 5 year and the 10 year averages.
Diclosures
- Trillium Square Advisors LLC is a registered investment adviser offering advisory services in the state of North Carolina and in other jurisdictions where exempted. Registration as an investment adviser does not imply a certain level of skill or training, and the content of this communication has not been approved or verified by the United States Security and Exchange Commission or by any state securities authority.
- Information presented is for educational purposes only and does not intend to make an offer or solicitation for the sale or purchase of any specific securities, investments or investment strategies. Market data, articles and other content in this presentation are based on generally available information and are believed to be reliable. Trillium Square does not guarantee the accuracy of the information contained in this presentation. The information is of a general nature and should not be construed as investment advice and relied upon in making investment decisions.
- Investments involve risk and are never guaranteed. Be sure to first consult with a qualified financial adviser before implementing any strategies discussed herein.
- Past performance is not indicative of future performance.
- The content of this communication and any accompanying documents are not to be copied, excerpted or distributed without express written permission of the firm. Any other use beyond its author’s intent, distribution or copying of the contents of this presentation is strictly prohibited. Nothing in this document is intended to be legal, accounting, or tax advise, and is for informational purposes only.
- Hypothetical performance results have many inherent limitations. No representation is being made that any account will or is likely to achieve profits or losses similar to those shown. In fact, there are frequently sharp differences between hypothetical performance results and the actual results subsequently achieved by any particular investment strategy. Hypothetical performance for illustration purposes only.
- Trillium Square will provide all prospective clients with a copy of our current Form ADV, Part 2A (Disclosure Brochure) upon request. At anytime you can view our current Form ADV, Part 2A at https://adviserinfo.sec.gov