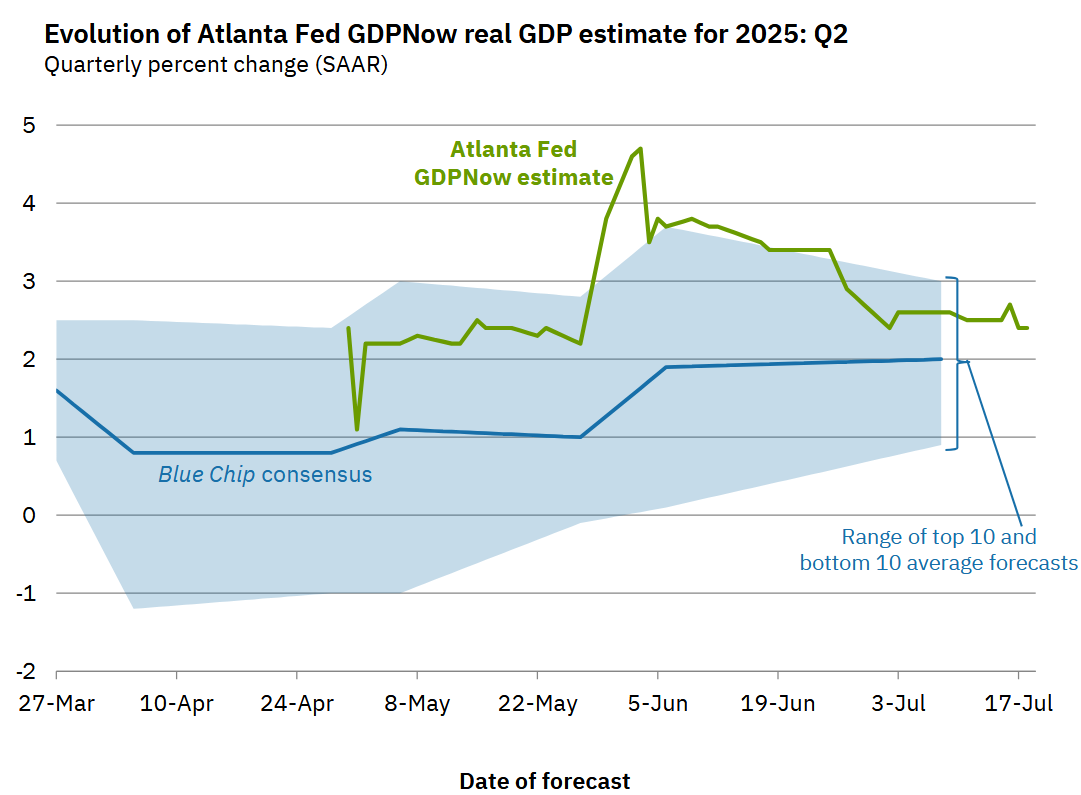
Atlanta FED GDPNow estimate for Q2 2025 is now tempered back to around 2% from
a high of 4+% last month.
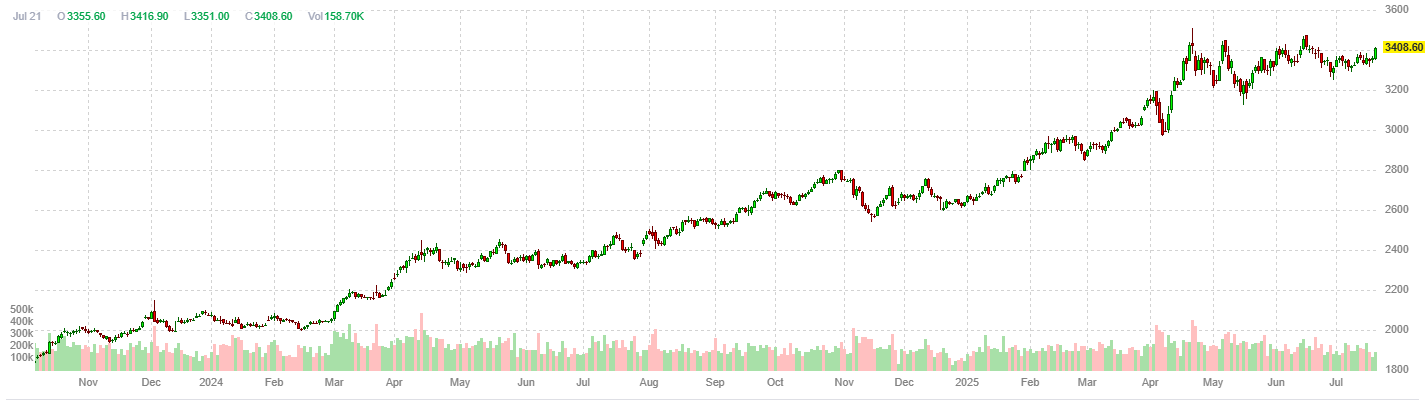
Gold has been marching higher steadily.
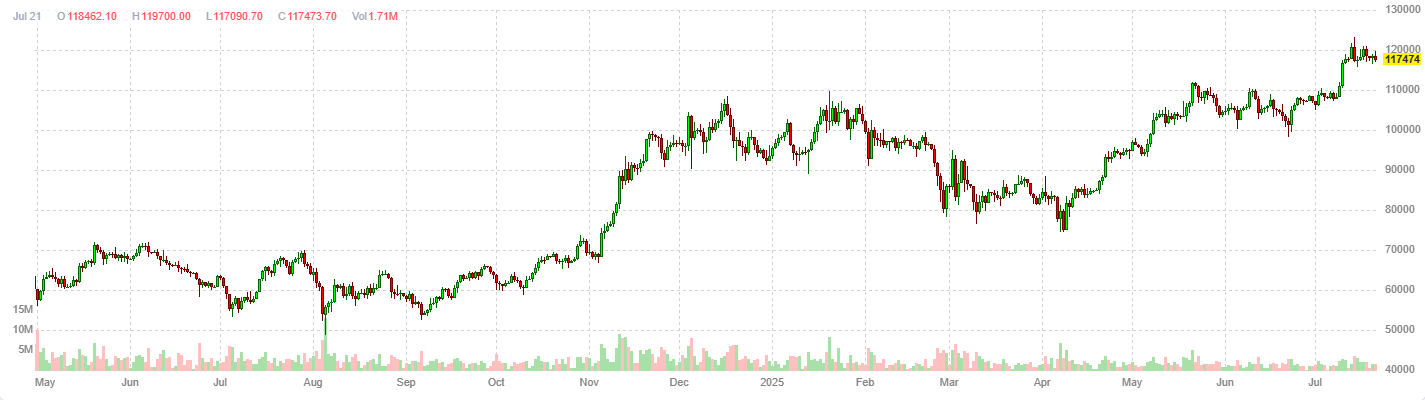
BitCoin continues to behave like a risk asset. Recently, the passing of the Genius Act is being touted as ChatGPT moment for crypto.
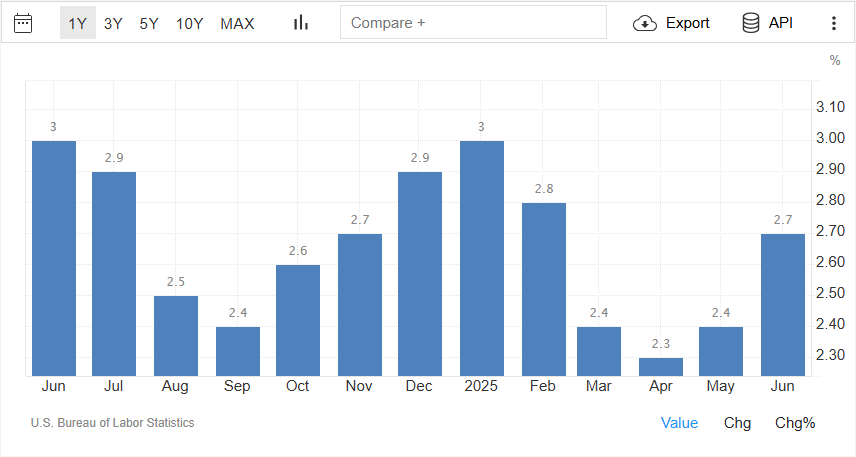
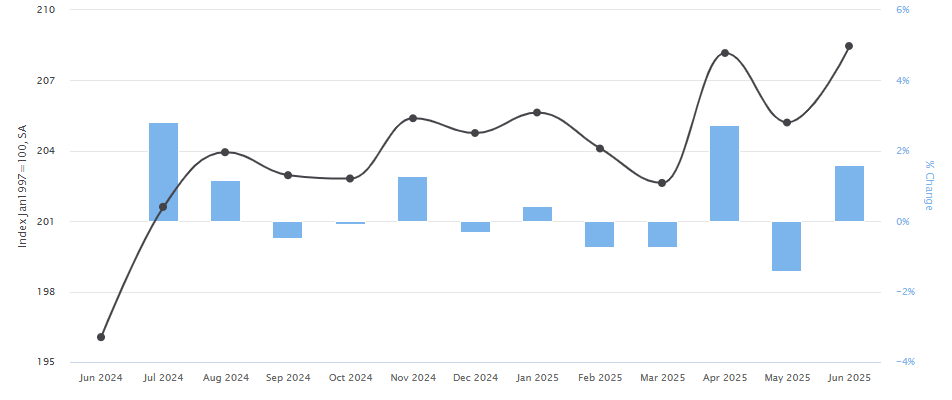
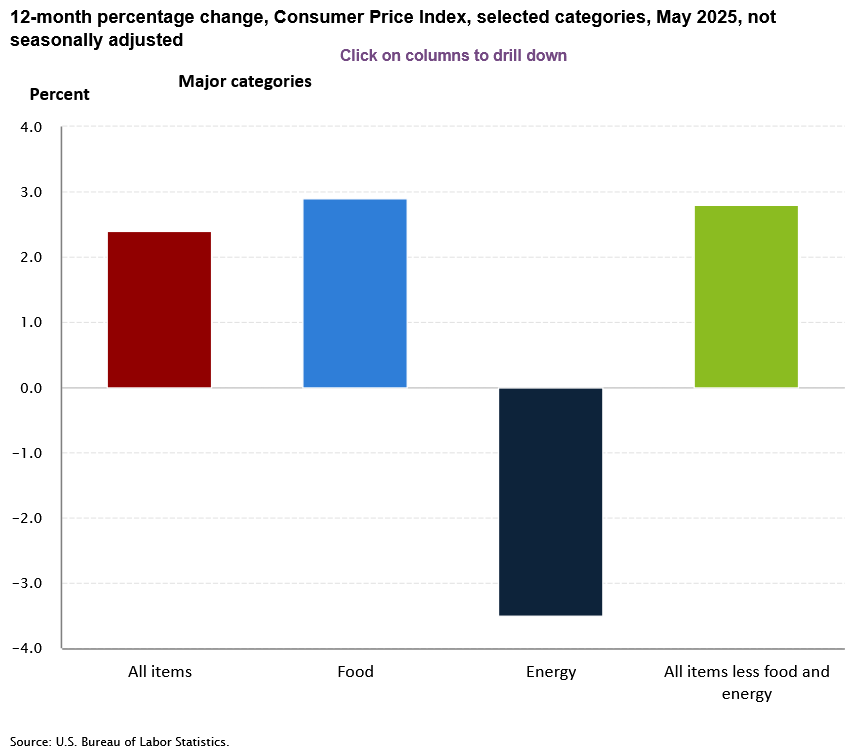 CPI Components Last Month
Source BLS.gov Consumer Price Index
CPI Components Last Month
Source BLS.gov Consumer Price Index
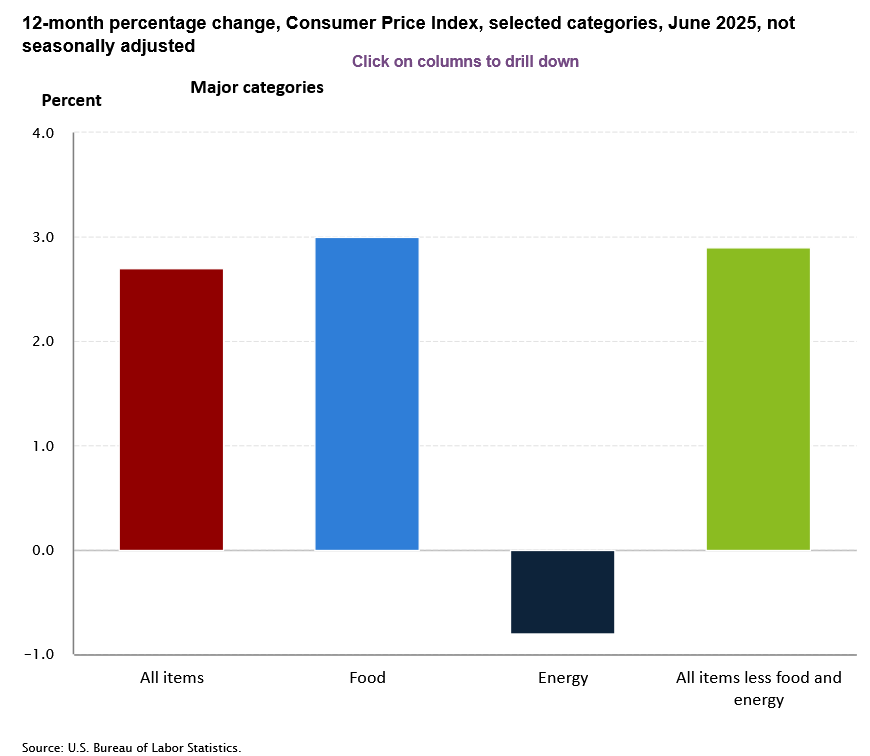 CPI Components This Month
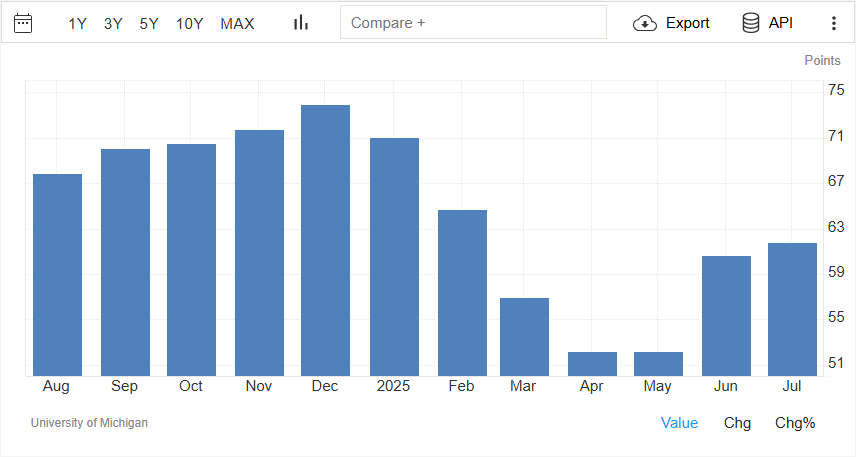
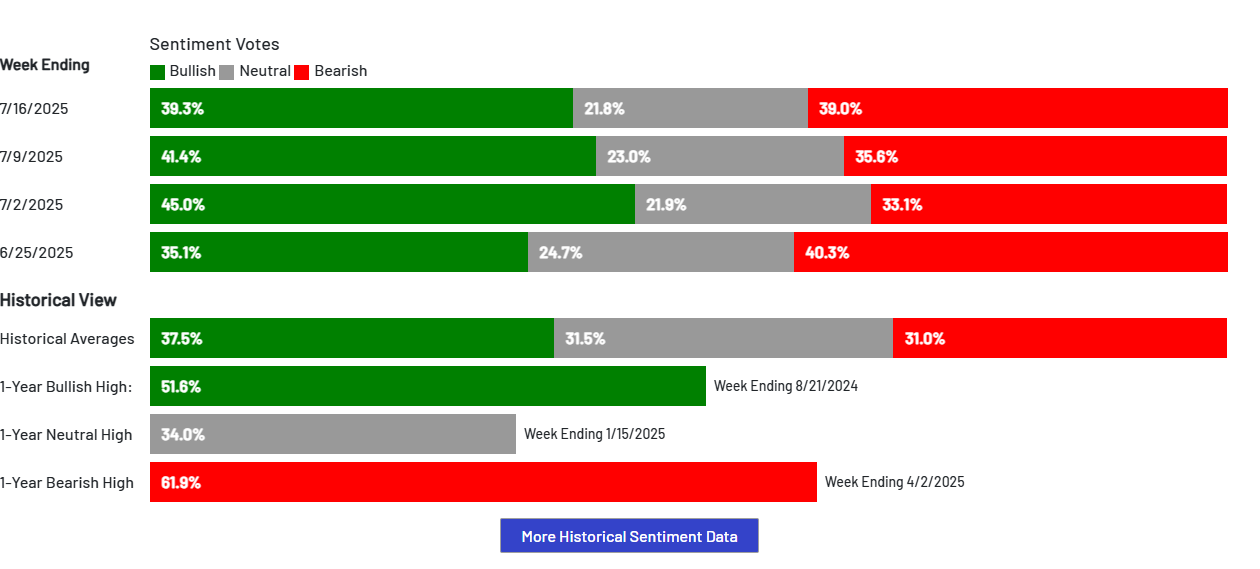
The AAII sentiment has been rebounding from a bearish stance a couple of months ago.
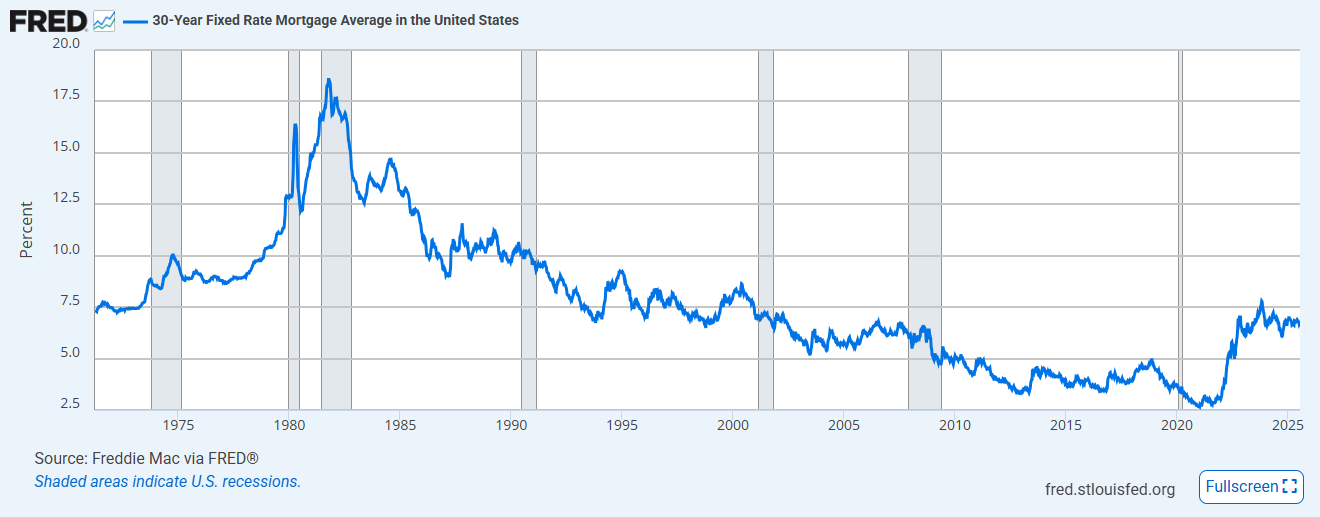
The mortgage rates have followed the 10-year Treasury yield higher over the last few weeks.
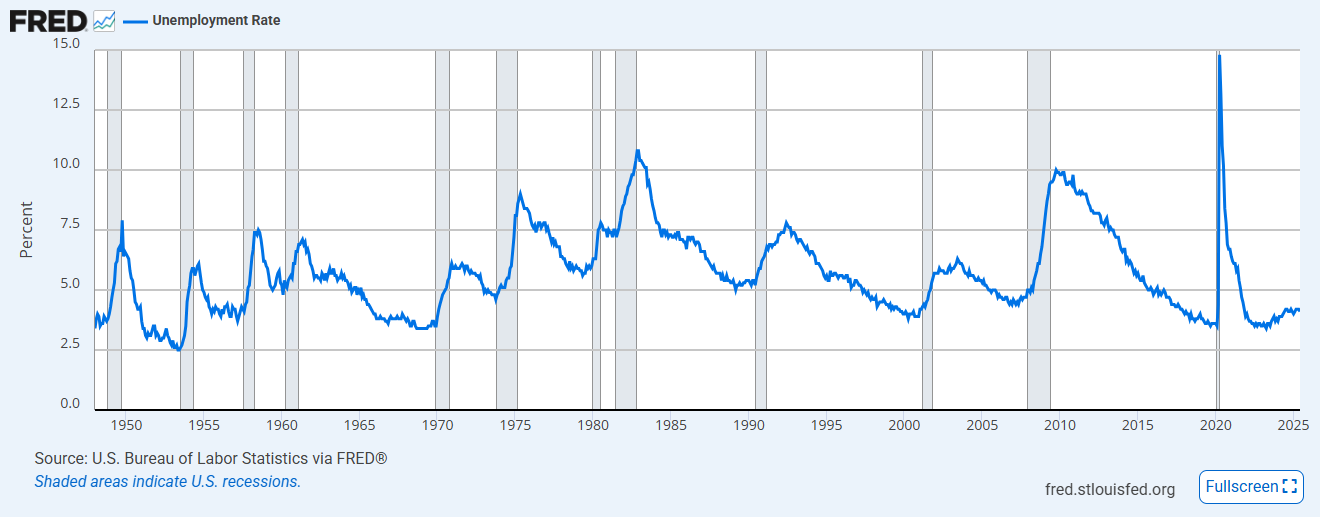
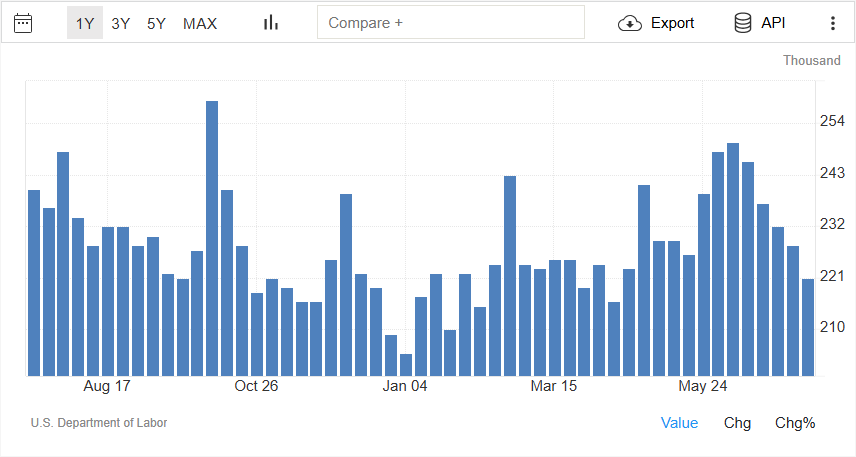
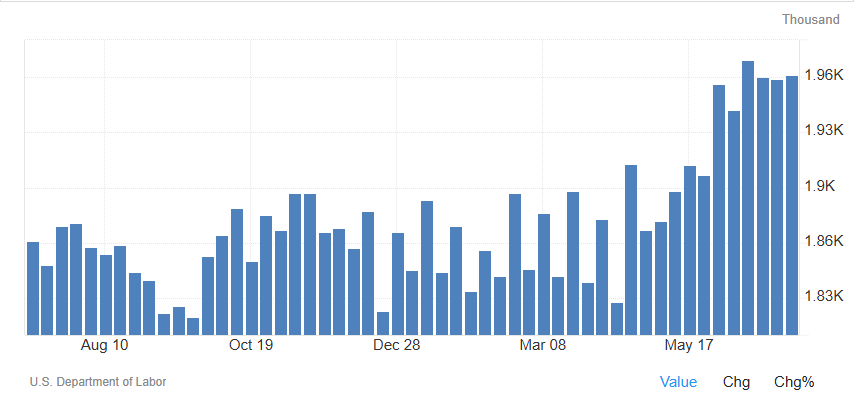 This chart will be the first indicator of a telltale sign that unemployment is increasing. As you see the continuing
jobless claims number rise, it implies the people who lost their jobs are not going back to labor force fast enough
and the unemployment rate is starting to creep higher. Over the last couple of weeks, it has remained roughly flat.
This chart will be the first indicator of a telltale sign that unemployment is increasing. As you see the continuing
jobless claims number rise, it implies the people who lost their jobs are not going back to labor force fast enough
and the unemployment rate is starting to creep higher. Over the last couple of weeks, it has remained roughly flat.
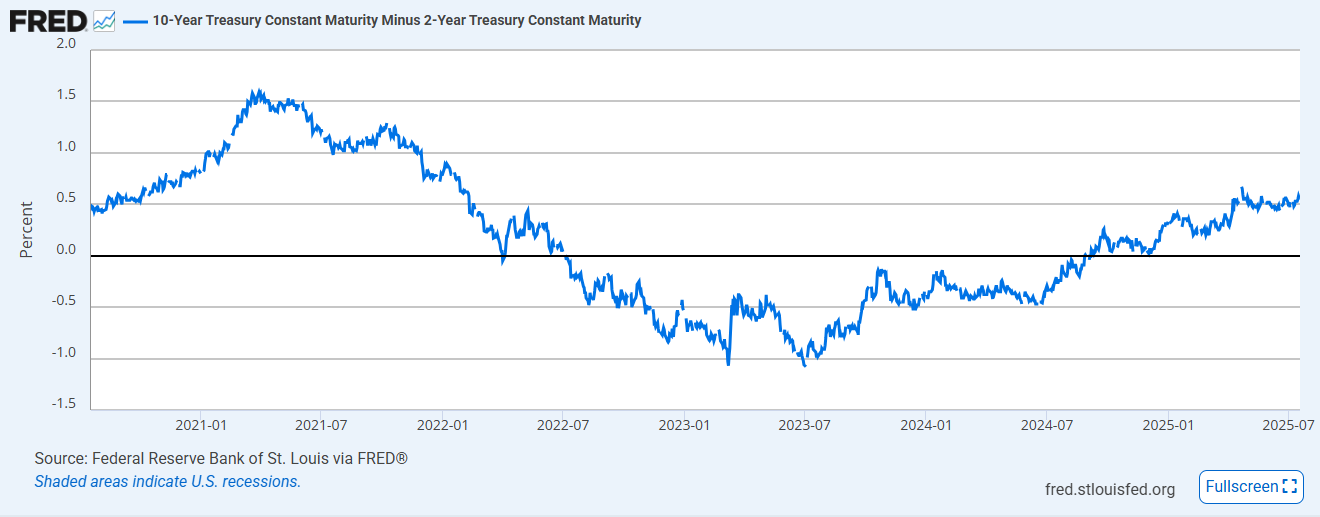
 Yield curve - Then
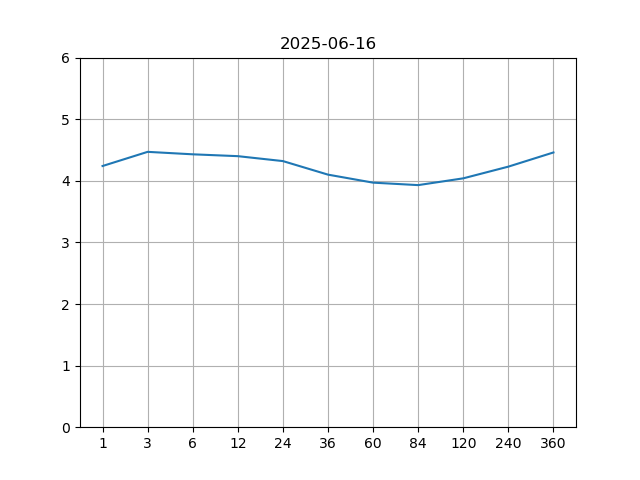
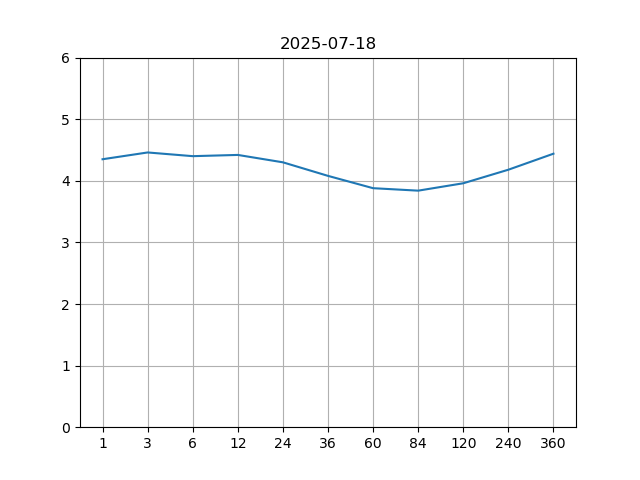 Yield curve - Now
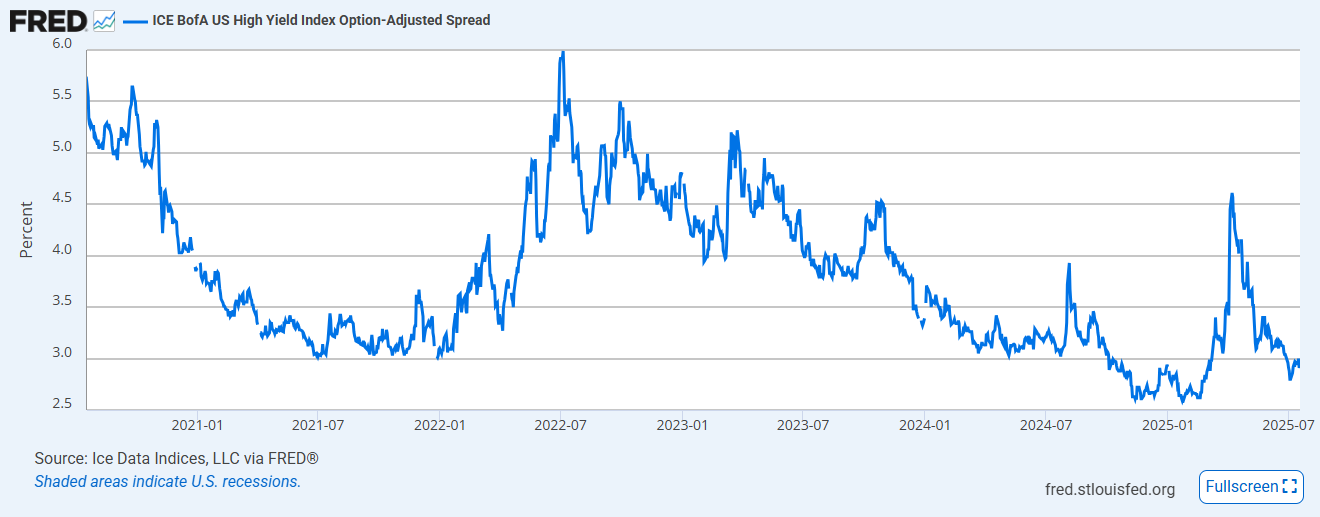
If the economy were to enter a recession, it is likely that some of the companies will struggle to keep up with their debt payments causing their credit spread to widen. This indicator shows how the credit spreads have been behaving well so far even in the face of the Yen carry trade unwind.
The spread is 2.8% currently and sharply rolled over since the April market correction.
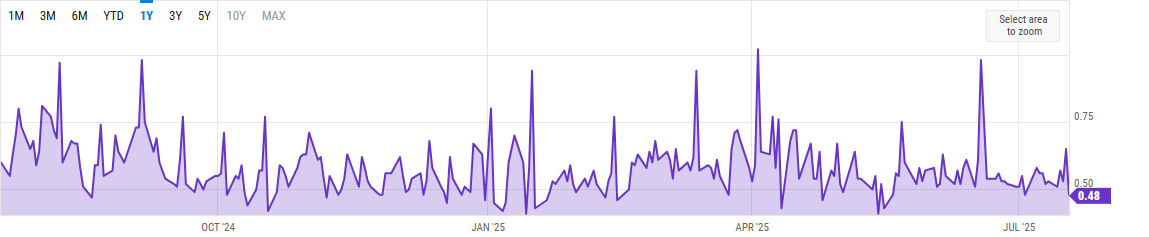
A spike in put / call ratio indicates that investors are very apprehensive about a sudden fall in the equity markets. The last spike seen is in late June when US dropped missiles in Iranian nuclear facilities.
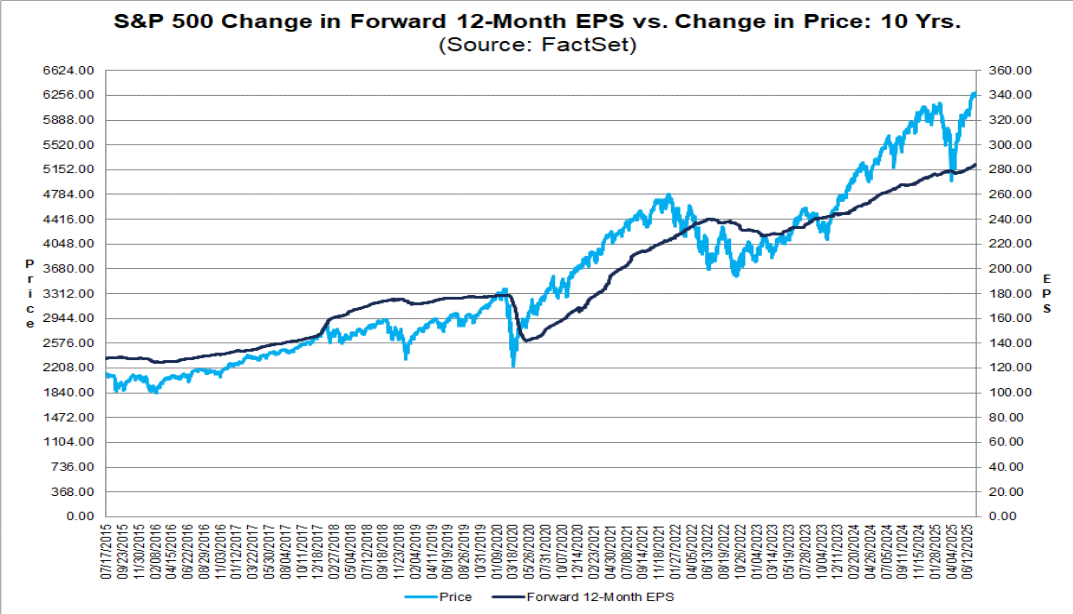
The current earnings forecast by equity analysts estimate the earnings potential for S&P 500 companies to be around $282 which translates to a price to earnings ratio of 22.1 at the current S&P 500 price level. This is above the 5 year and the 10 year averages. Earnings season for Q2 is earnestly underway and we are looking to see how USD decline and tariffs affect the earnings growth.
© Copyright Trillium Square Advisors LLC. All rights reserved.