Economic Updates for March 2025
Summary
Market Shifts and Economic Uncertainty: Navigating 2025's Volatility
The markets are off their all time highs and the economic conditions are starting to weaken.
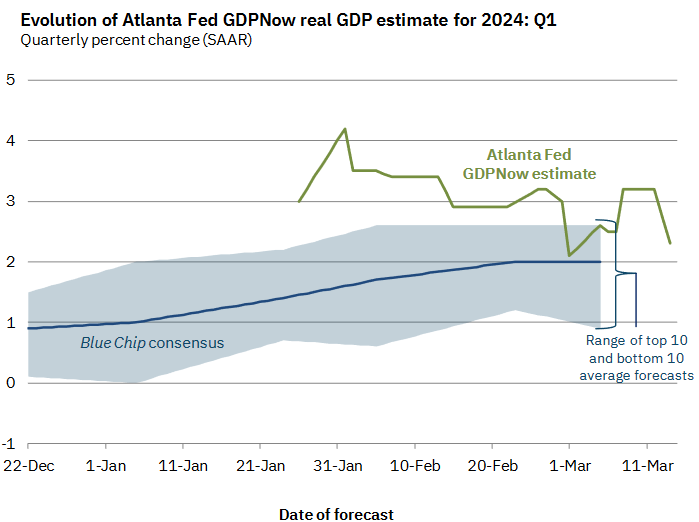
Regarding the economy, the GDP expectations for Q1 2025 has gone negative to -2.5%. While this may e a short term indicator due to a sharp increase in imports led by companies stockpiling inventories in fear of the upcoming tariffs, it remains to be seen if the economy starts to weaken on other fronts such as jobs and industrial production. Jobs report has been reasonably good for February. Both Manufacturing PMI and Services PMI indicate expansion.
All eyes have turned to the US Dollar. There is a lot of talk on what the government might do and how it might impact the US Dollar. While tariffs by themselves would push up the Dollar in comparison to other world currencies, a drop in Dollar may further reduce imports. The proposed Mar-a-Lago Accord has all the underpinnings to lower the Dollar with the favorable consequence of lowering US liabilities. It will be interesting to see how this plays out over the next few months to a year.
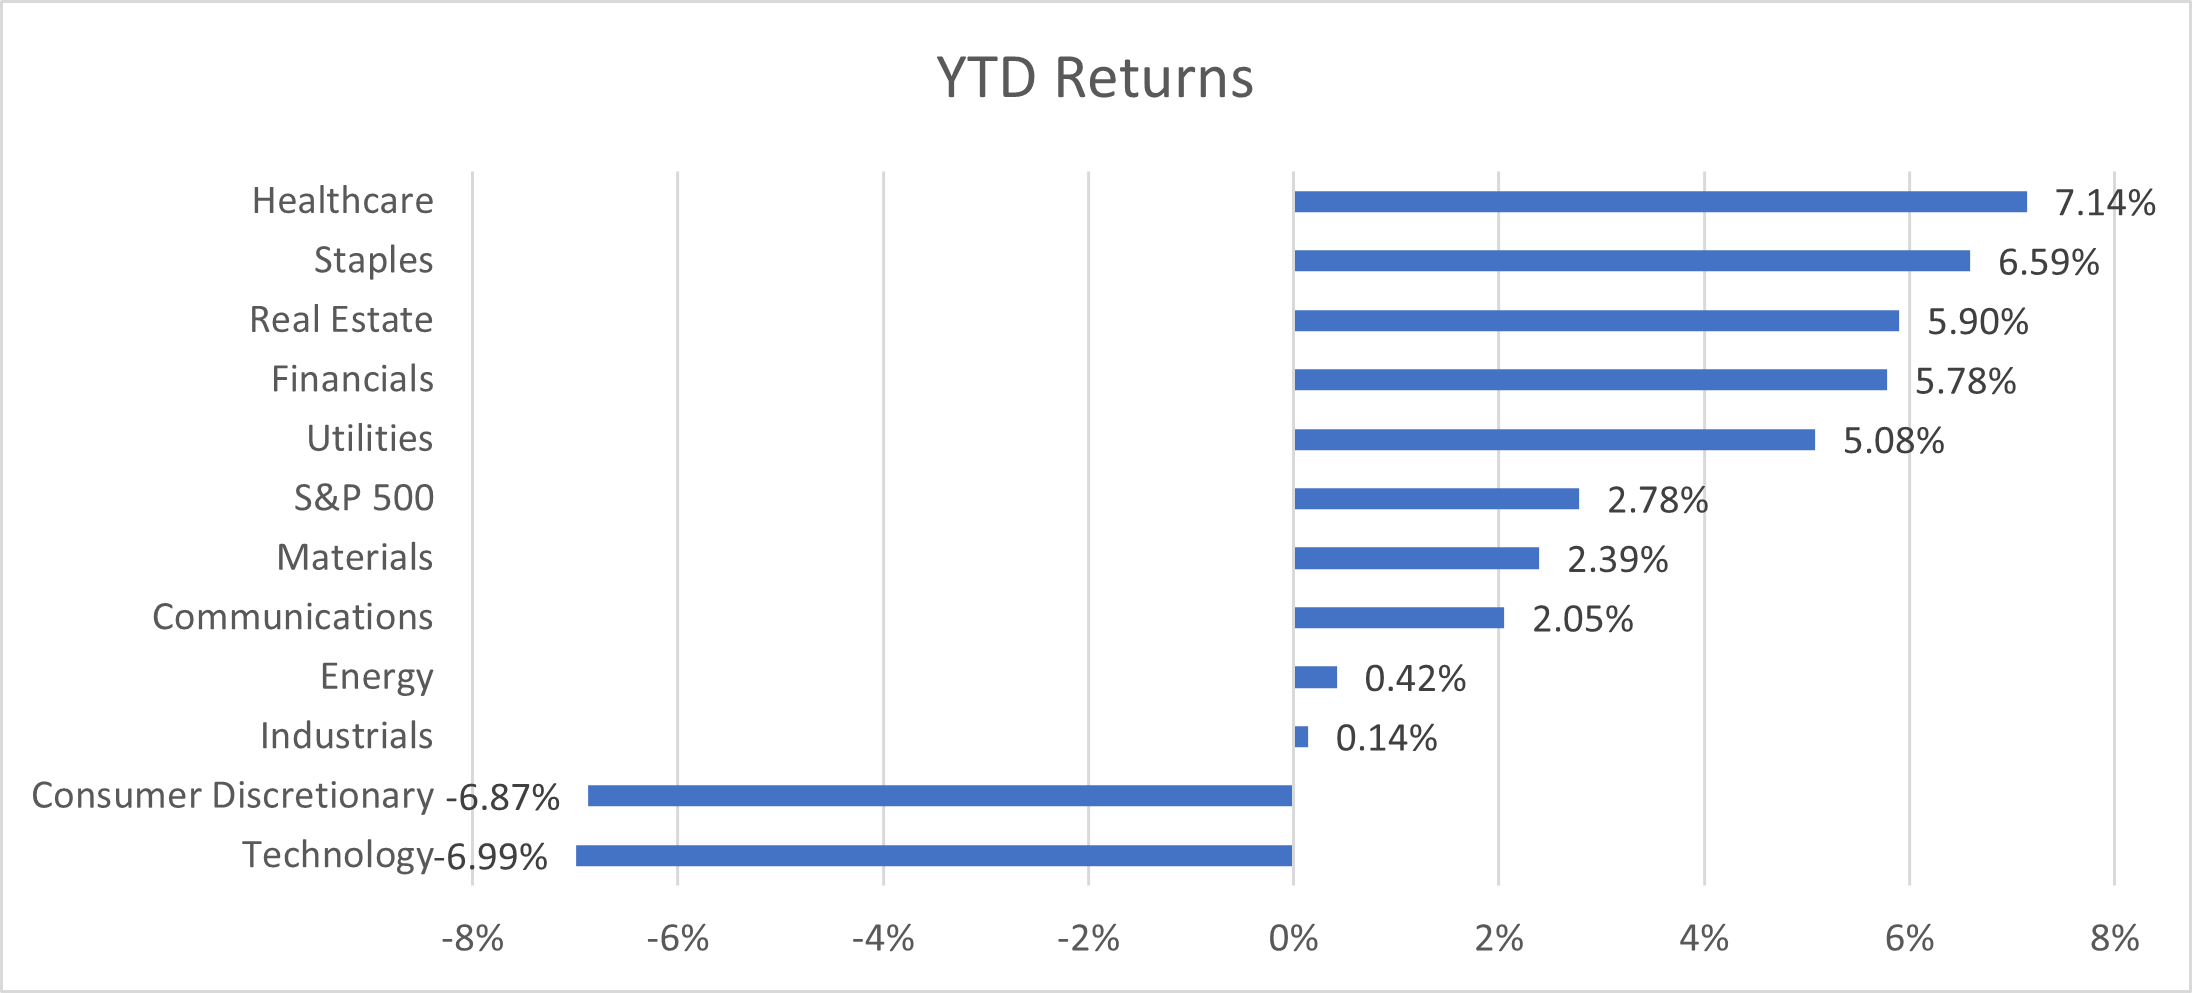
On the markets, we have seen higher volatility in the tech and momentum trades. There has been a decisive rotation to healthcare and more defensive sectors such as consumer staples. Investor sentiment has also weakened. There are no immediate catalysts for buying the dip as we have also been noticing a rotation trade from US domestic markets to international developed markets. With the recent elections in Germany followed by a government that has pledged whatever it takes to prop up the German economy, this may be a good time to look for greener pastures across the pond.
In all, we expect the volatility to continue for some more time as the fiscal policy changes play out. It appears that staying broad and diversified is a good strategy for 2025.
Broad Indicators
Atlanta GDP NowCast
US Dollar Index
The new government is working on its policy framework that may have a significant impact on USD. The proposed Mar-a-Lago Accord is intended to push USD lower and make exports favorable and imports less favorable among other things. It is possible we are seeing early signs of this taking shape.
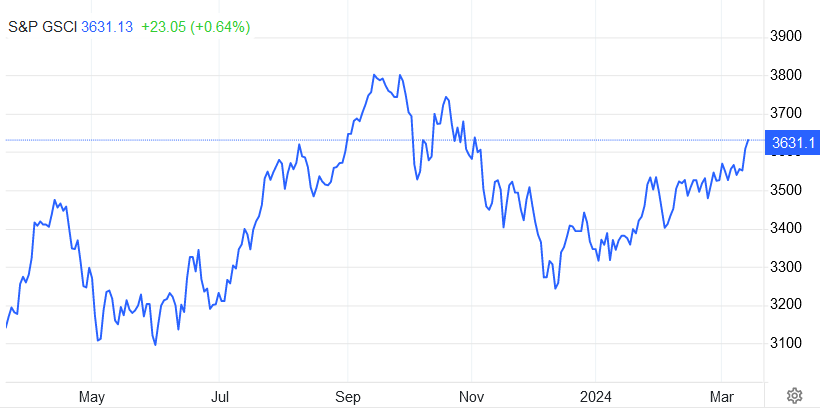
Commodities
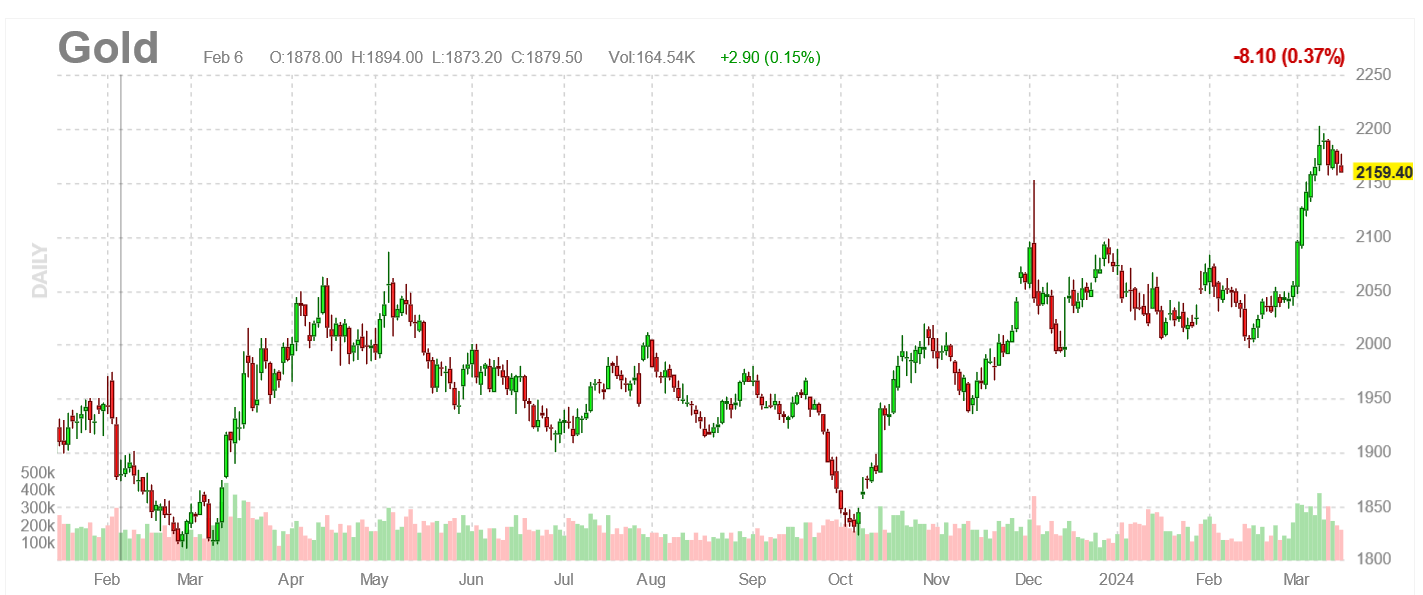
Gold
Gold continues to perform very well as the USD may see higher volatility with the shake up in global trade.
Bitcoin
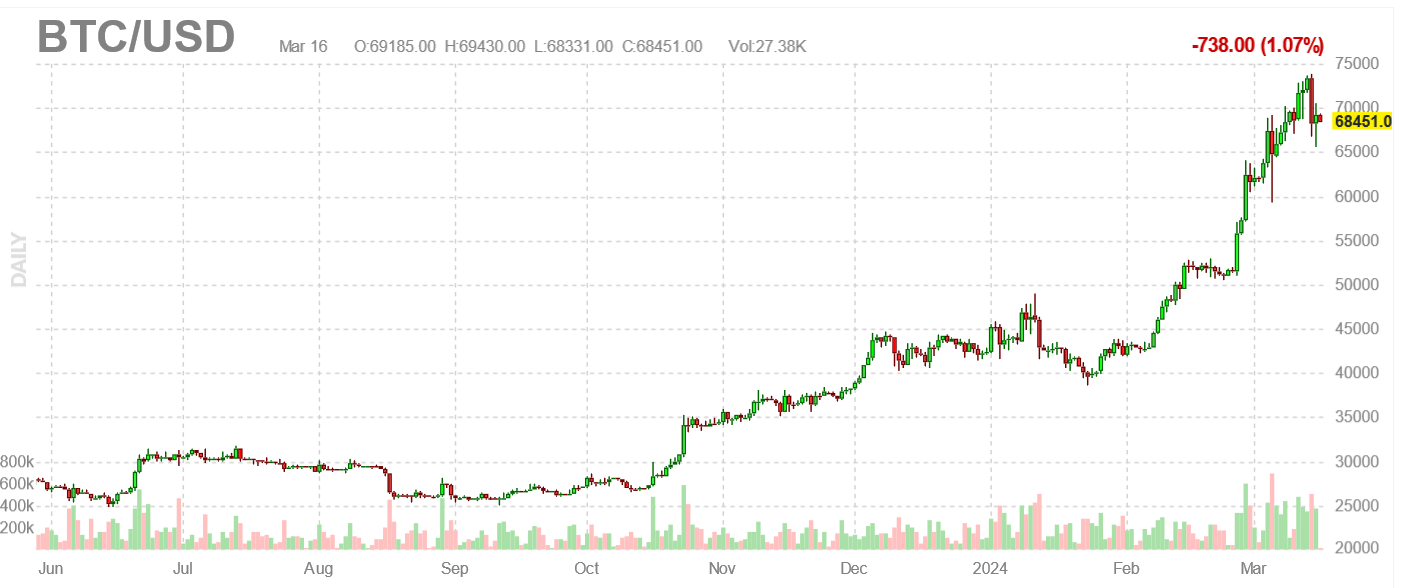
BitCoin continues to behave like a risk asset such as tech stocks. Recently, there has been some optimism with the talks of a sovereign bitcoin reserve.
Inflation
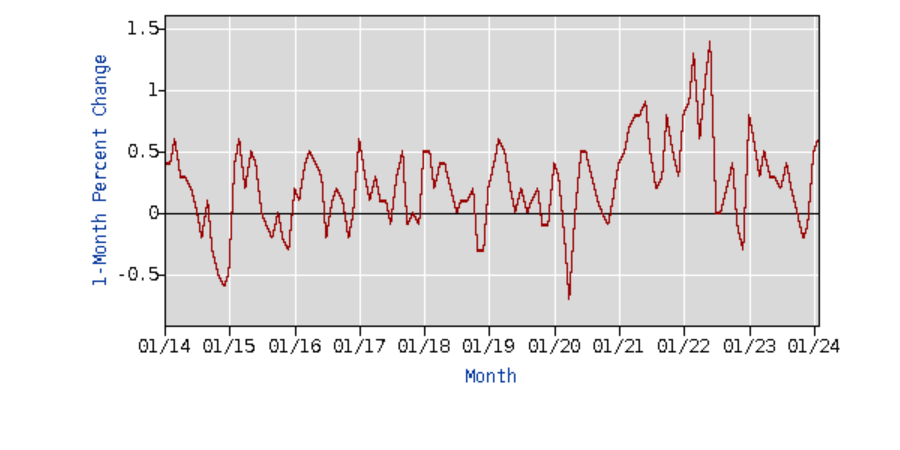
CPI Month over Month
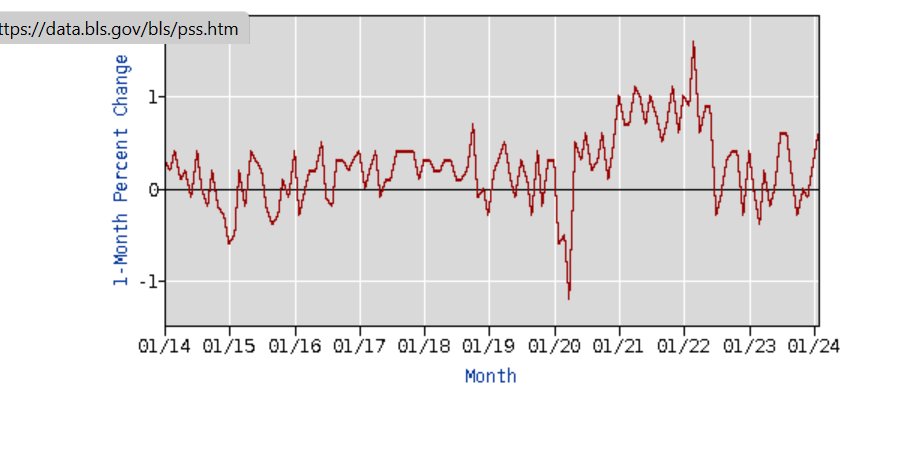
PPI Month over Month
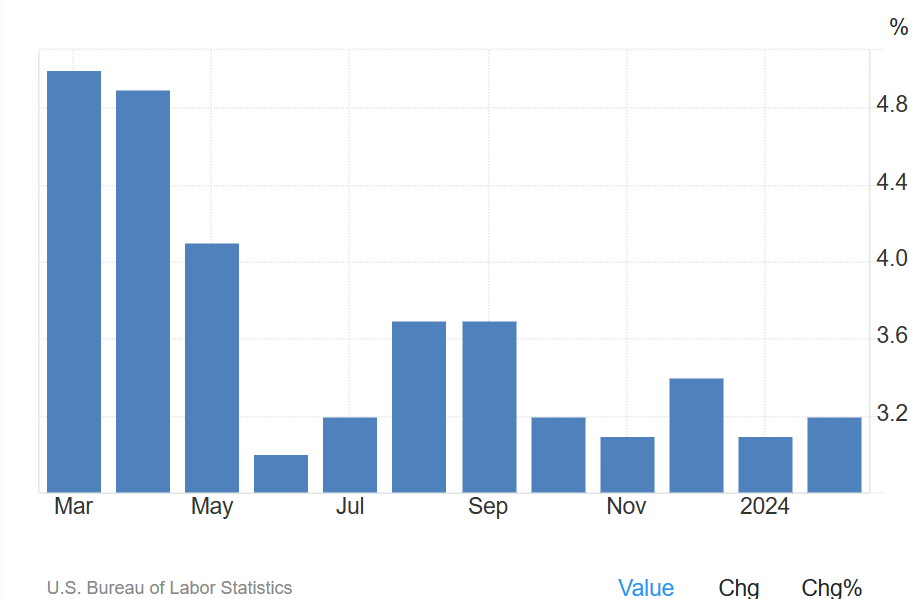
Reported Year over Year Inflation Rate
CPI Components
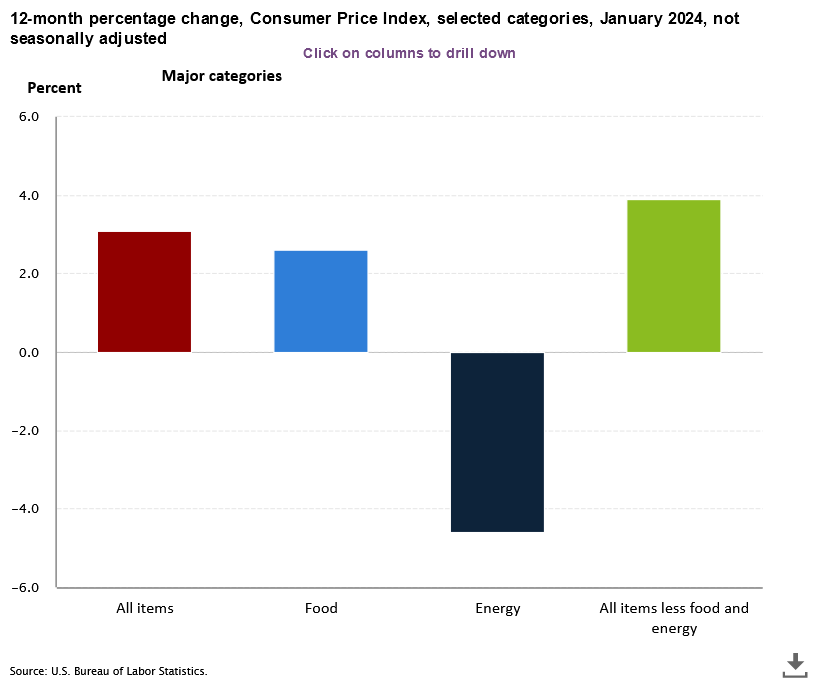 CPI Components Last Month
Source BLS.gov Consumer Price Index
CPI Components Last Month
Source BLS.gov Consumer Price Index
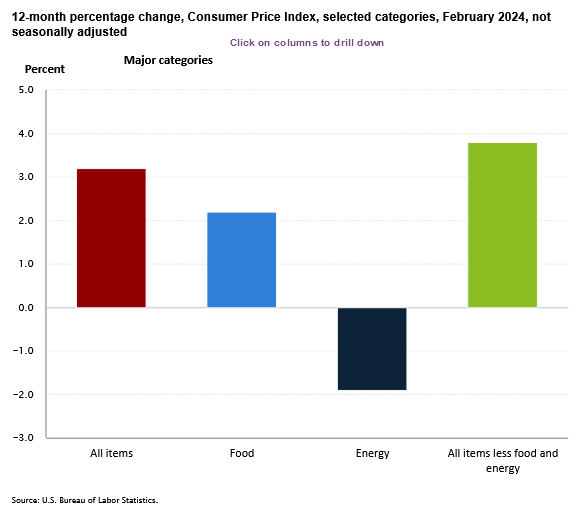 CPI Components This Month
The contributors to the inflation have been mainly food and transportation. (Please note that the y-axis in both the graphs have different scales).
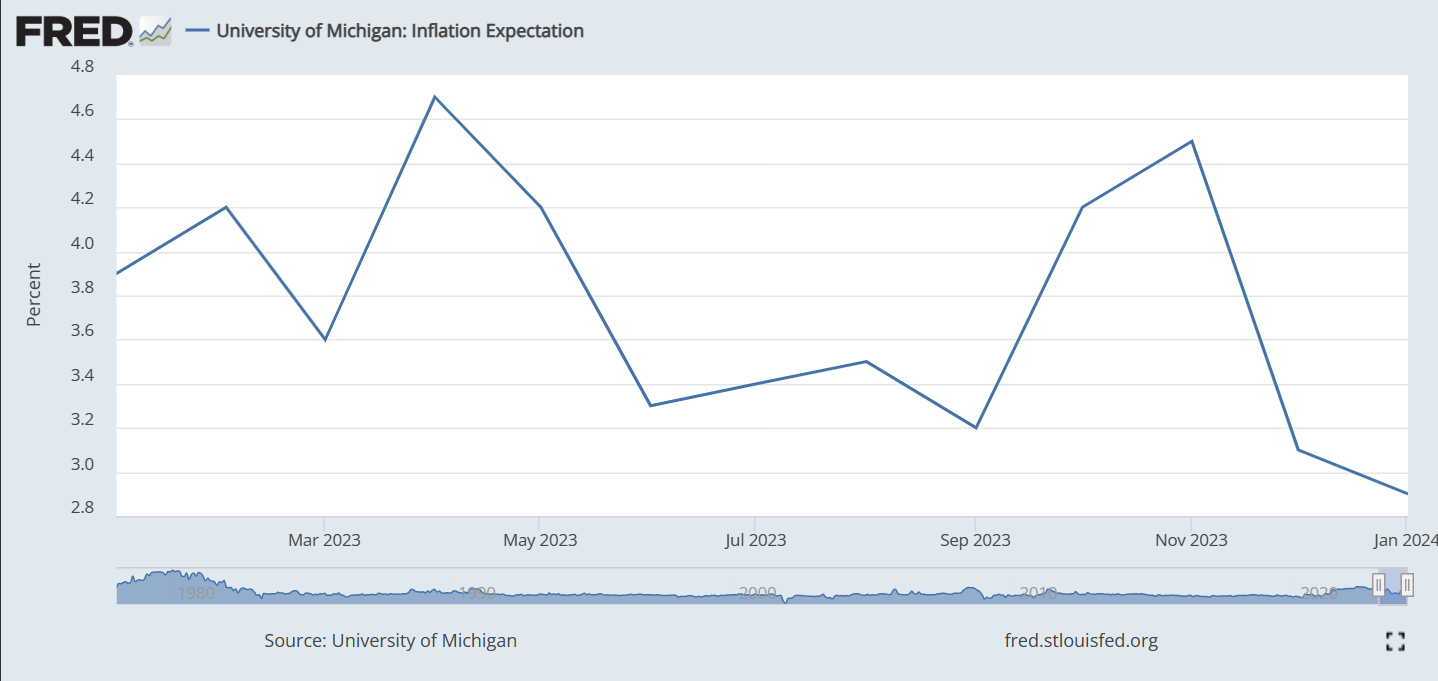
One Year Inflation Expectations
Sentiments
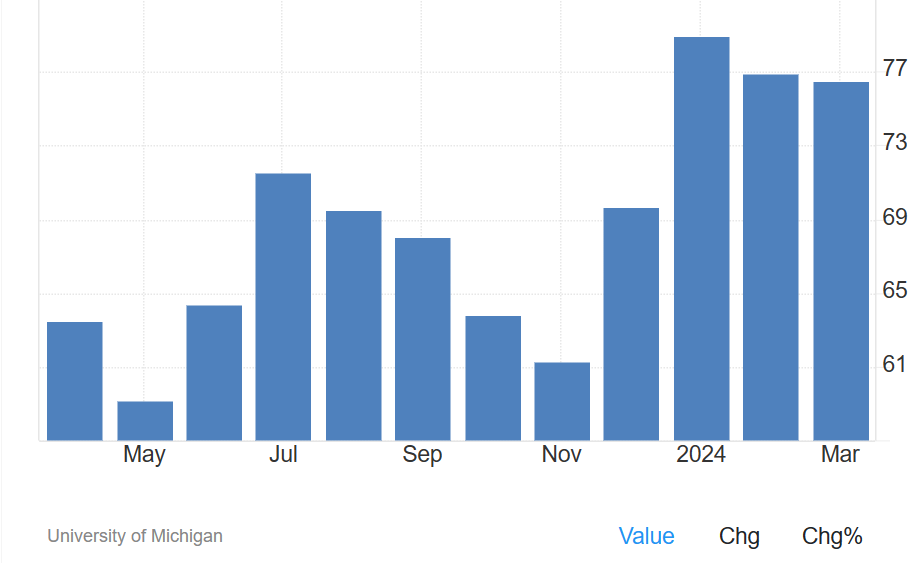
Consumer Sentiments
Investor Sentiments
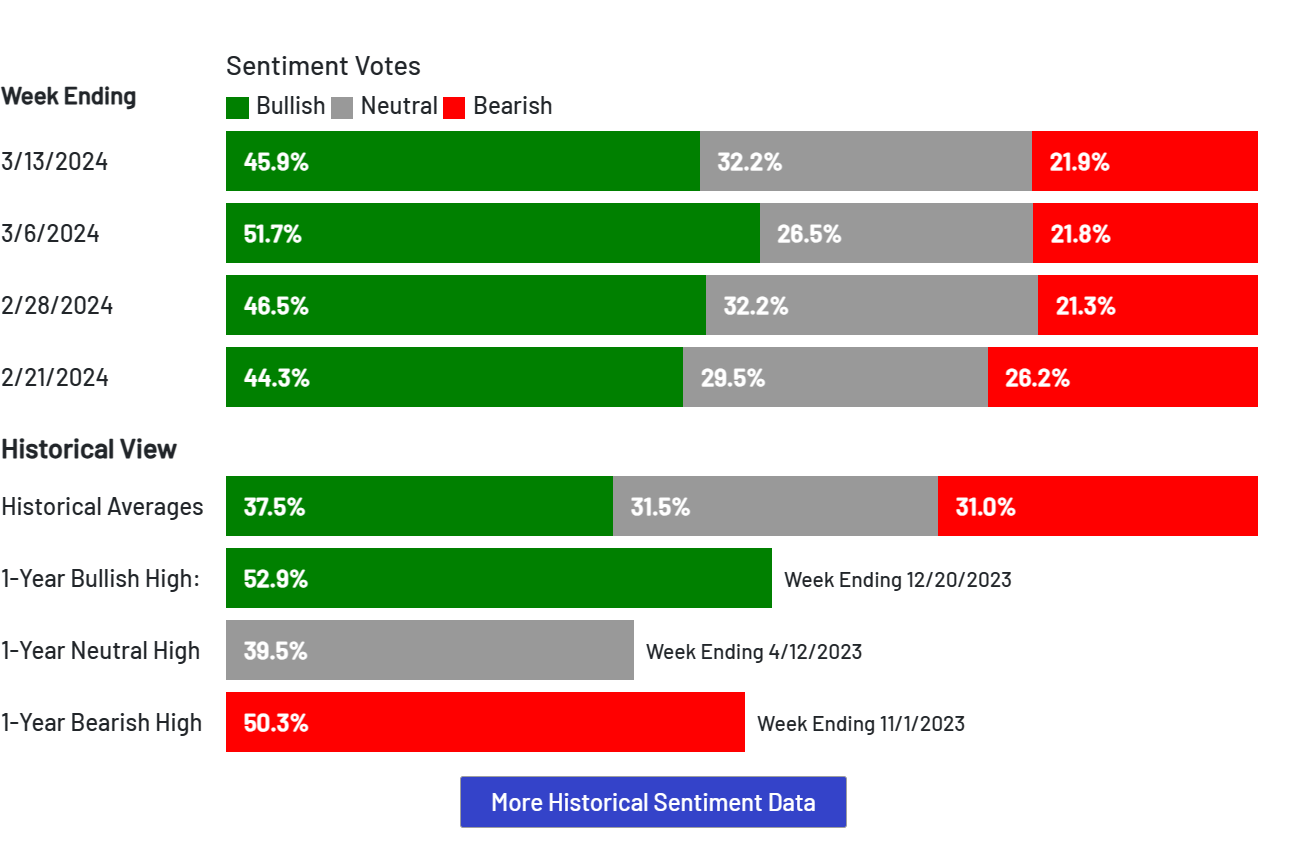
The AAII sentiment has been turning bearish over the last few weeks.
GDP Factors
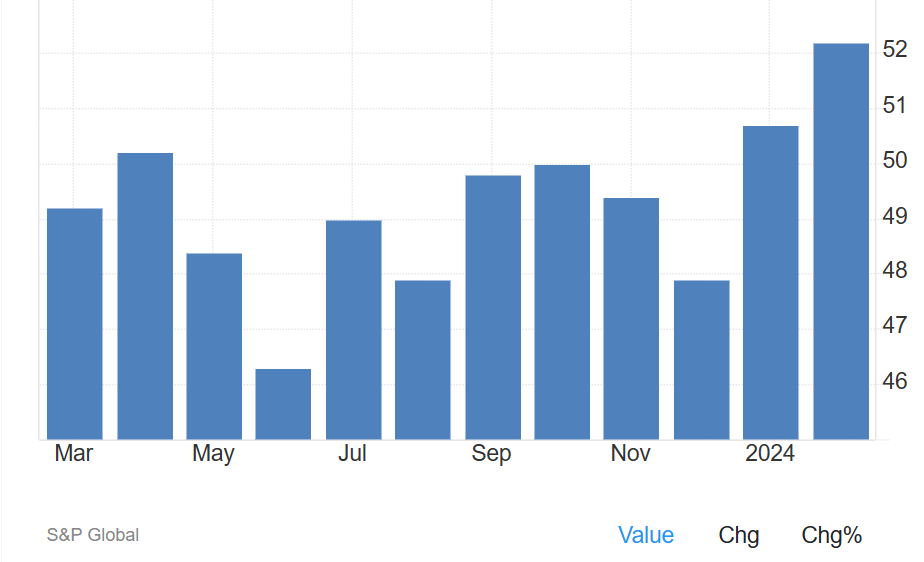
Manufacturing PMI
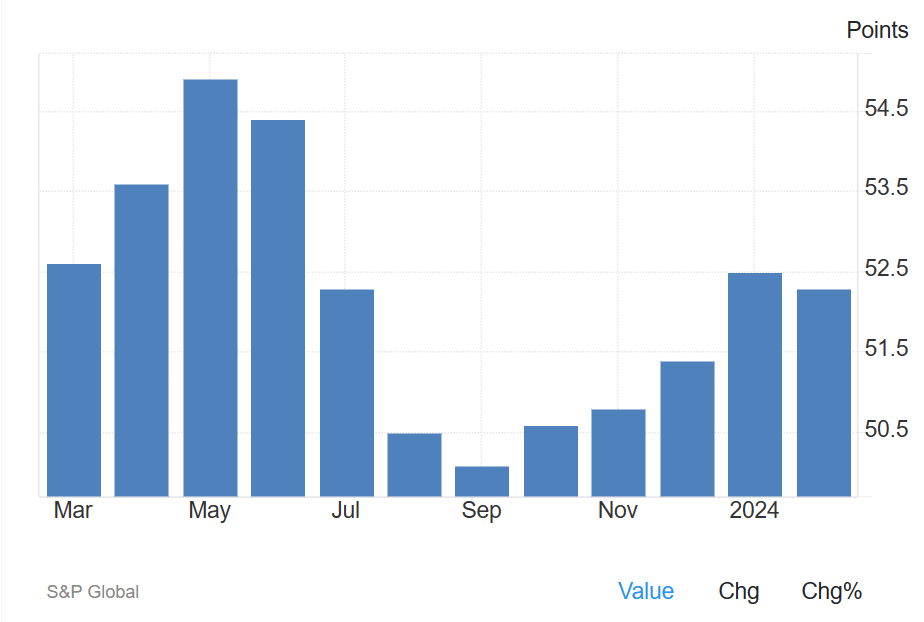
Services PMI
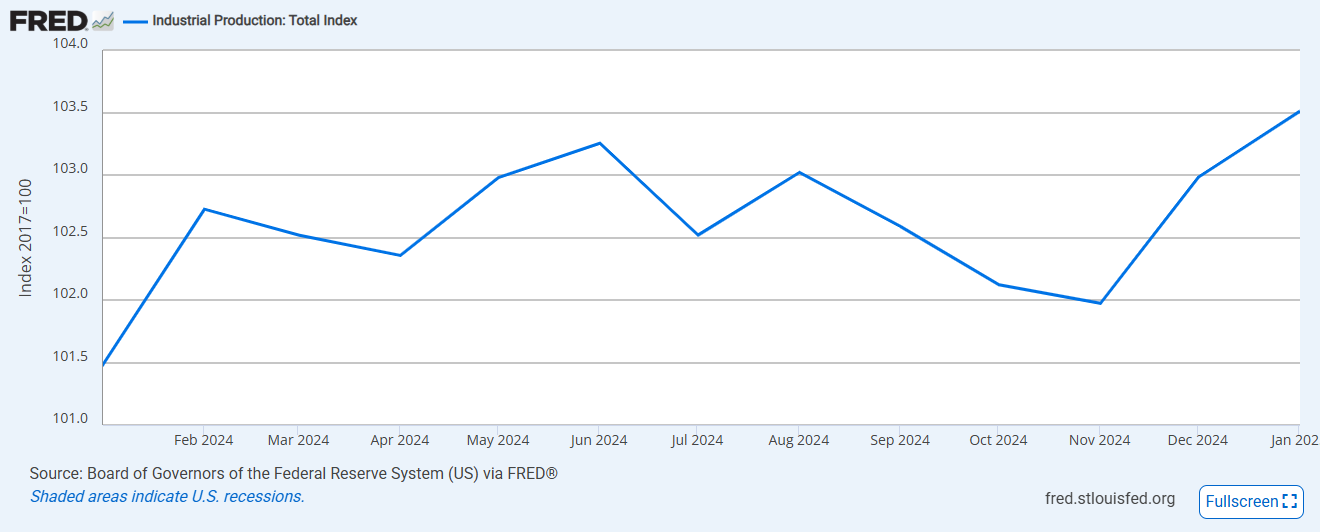
Industrial Production
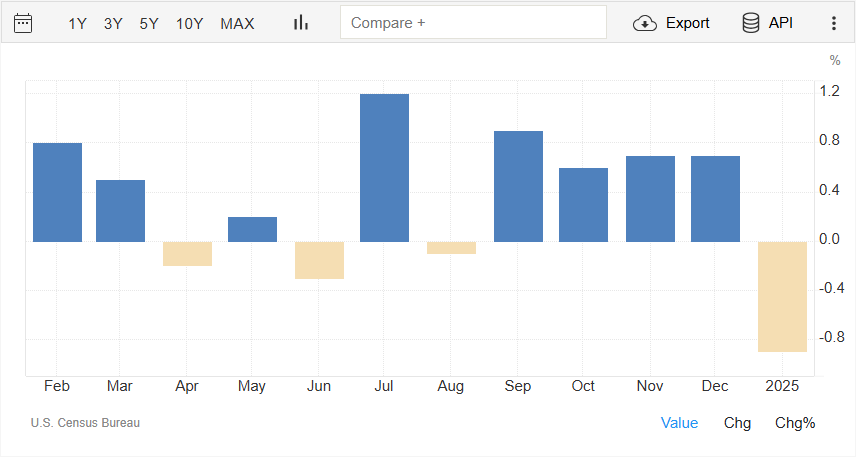
Retail Sales
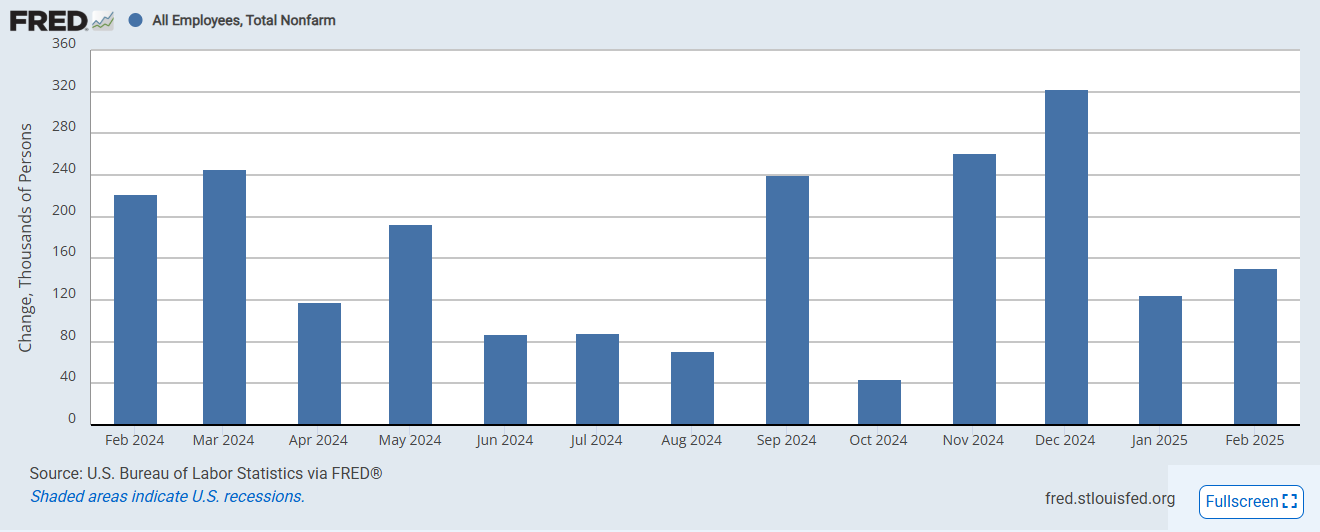
Non-farm Payrolls
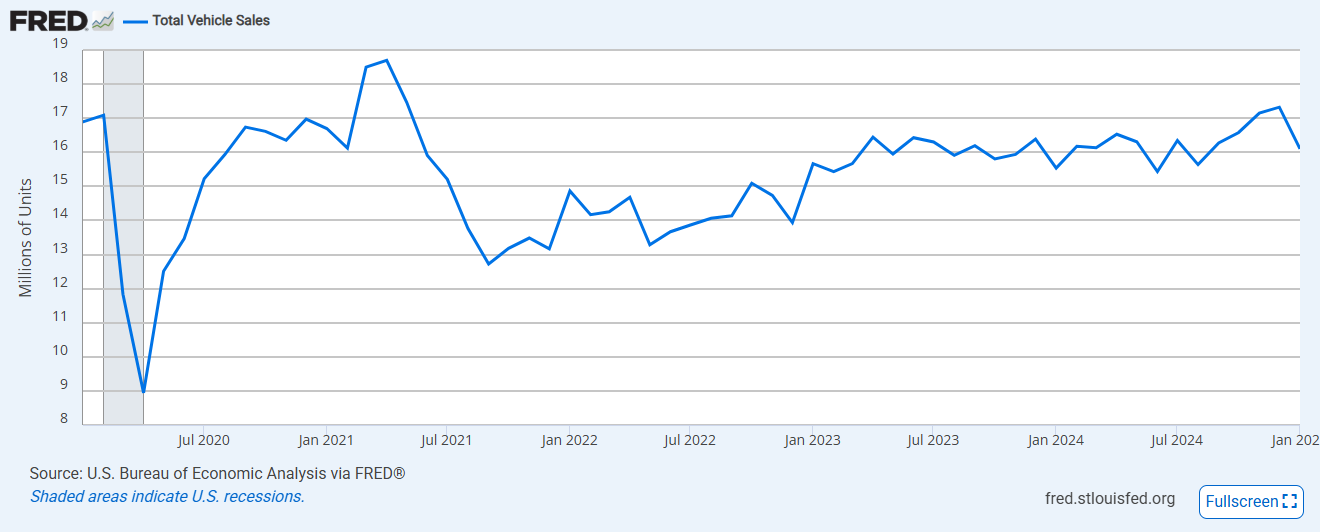
Total Vehicle Sales
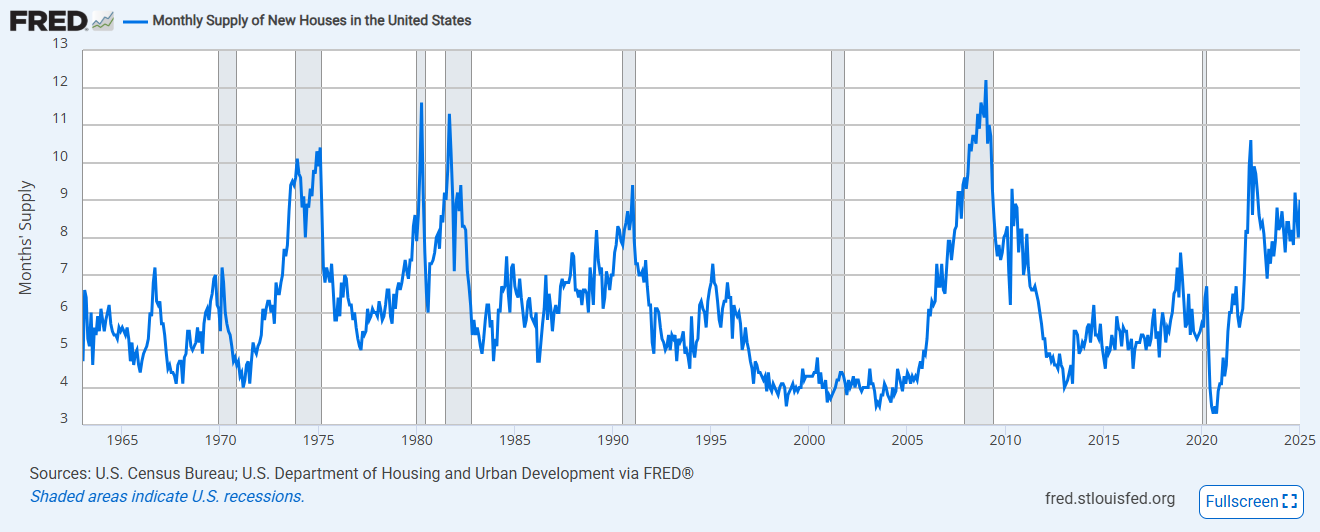
US New Home Sales
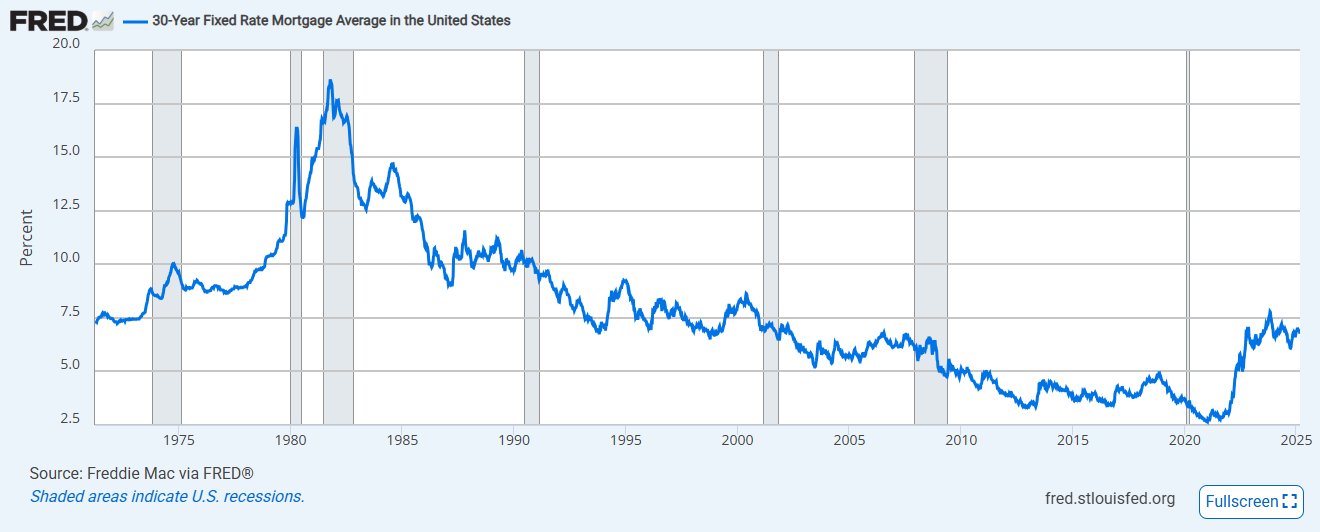
30 Year Fixed Mortgage Rates
The mortgage rates have followed the 10-year Treasury yield lower over the last couple of weeks.
Employment Indicators
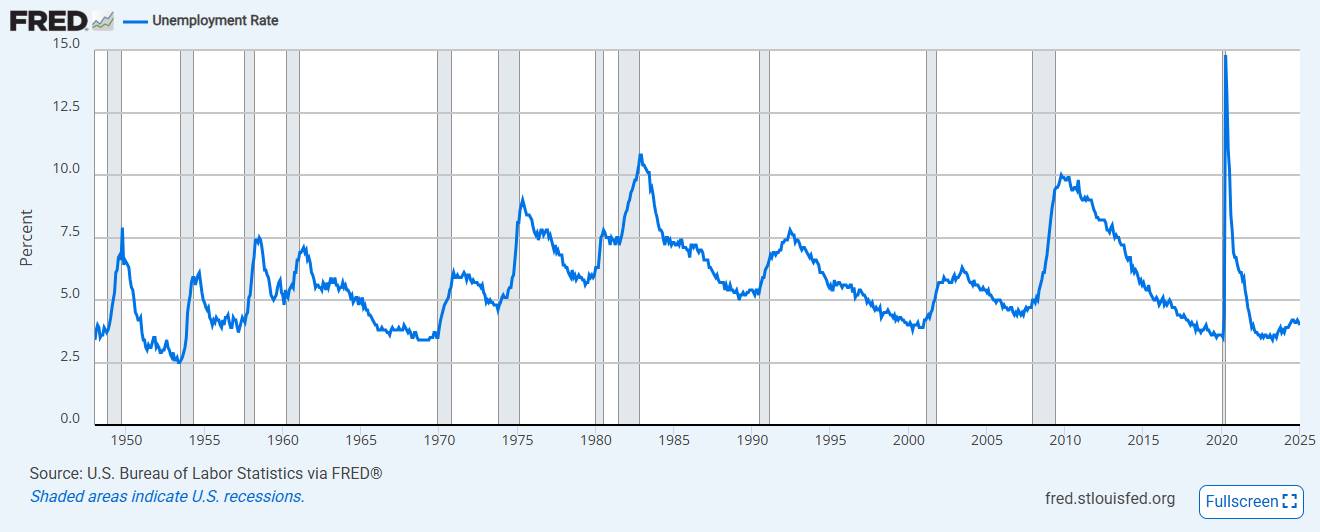
Historical Unemployment Rate
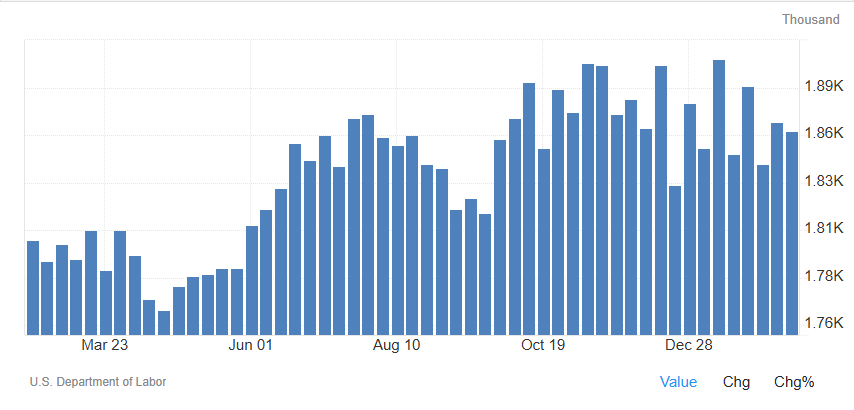
US Jobless Claims
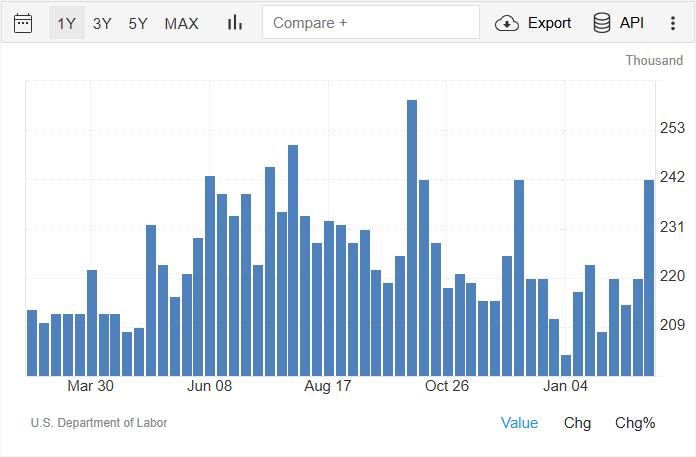
 This chart will be the first indicator of a telltale sign that unemployment is increasing. As you see the continuing
jobless claims number rise, it implies the people who lost their jobs are not going back to labor force fast enough
and the unemployment rate is starting to creep higher. Over the last couple of weeks, it has remained roughly flat.
This chart will be the first indicator of a telltale sign that unemployment is increasing. As you see the continuing
jobless claims number rise, it implies the people who lost their jobs are not going back to labor force fast enough
and the unemployment rate is starting to creep higher. Over the last couple of weeks, it has remained roughly flat.
Market Indicators
Yield Curve Inversion
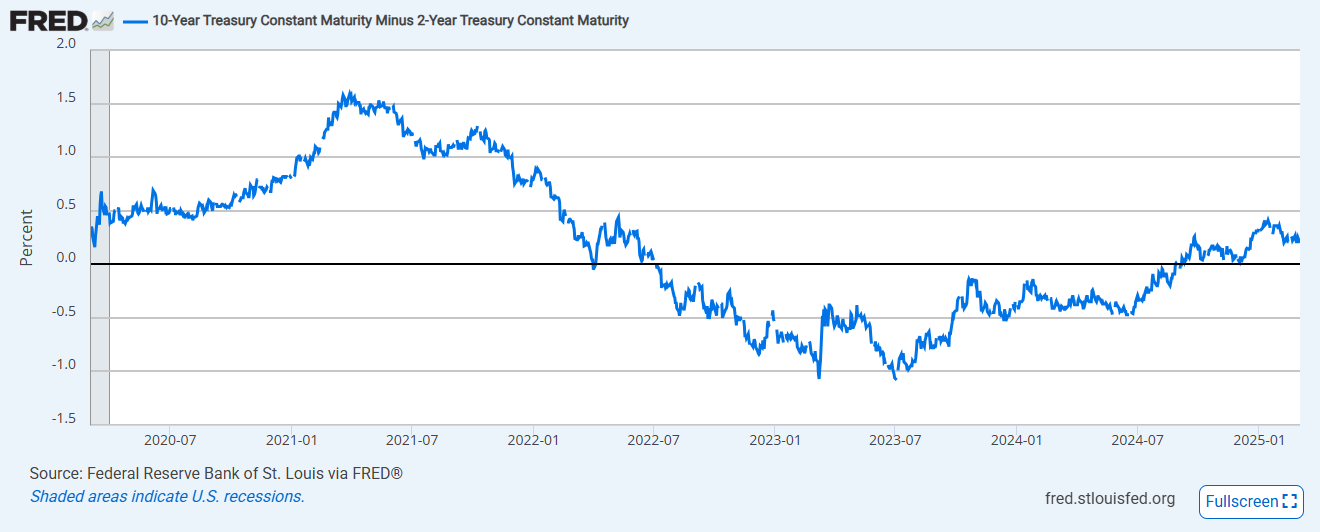
Yield Curve - then and now
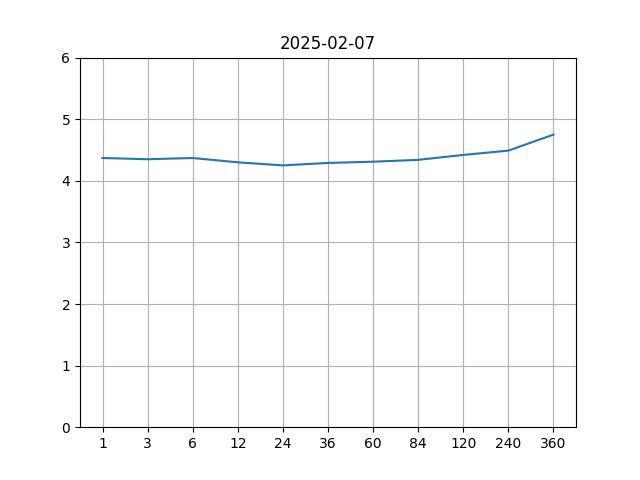 Yield curve - Then
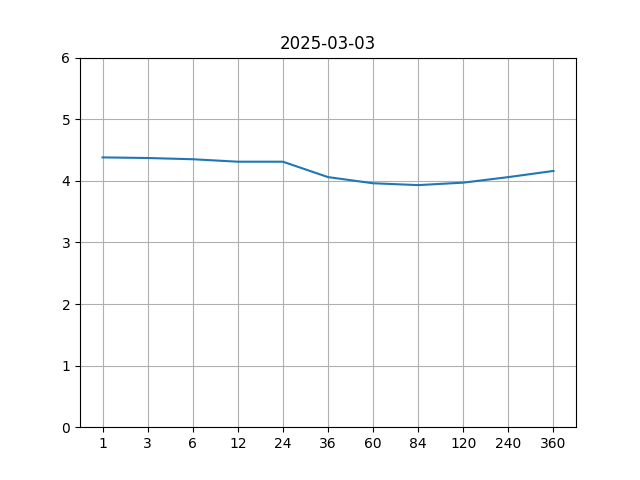 Yield curve - Now
 The yield curve is certainly reverted back to normal. Over the last few weeks, the long end of the rates have edged lower.
Market Sectors
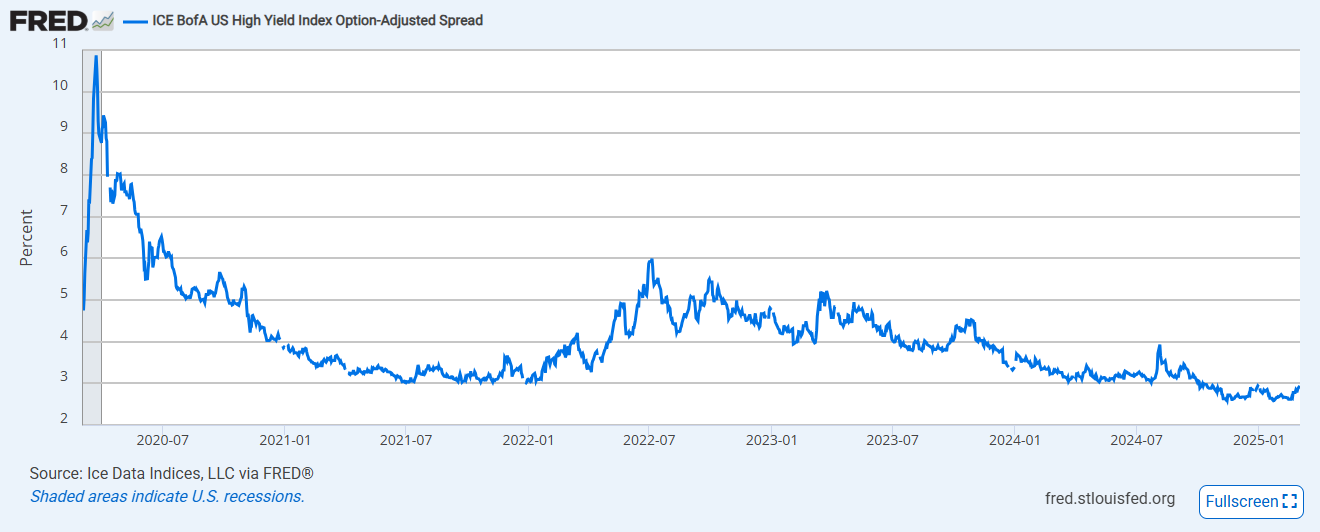
High Yield Index Options-Adjusted Spread
If the economy were to enter a recession, it is likely that some of the companies will struggle to keep up with their debt payments causing their credit spread to widen. This indicator shows how the credit spreads have been behaving well so far even in the face of the Yen carry trade unwind.
The spread is 2.99% currently and it is starting to widen from the tightest levels we have seen recently.
Put Call Ratio
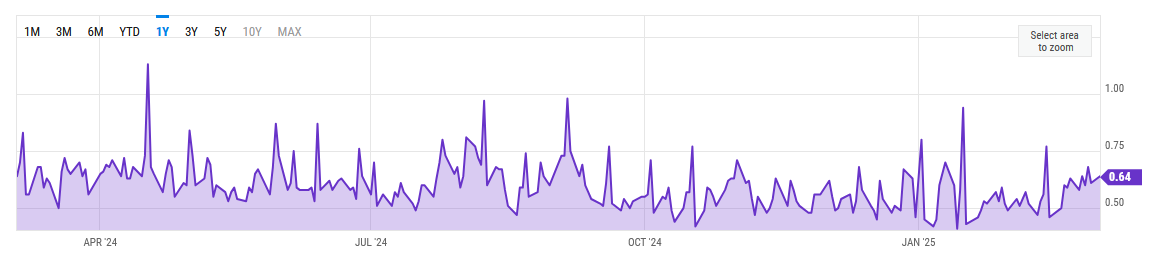
A spike in put / call ratio indicates that investors are very apprehensive about a sudden fall in the equity markets.
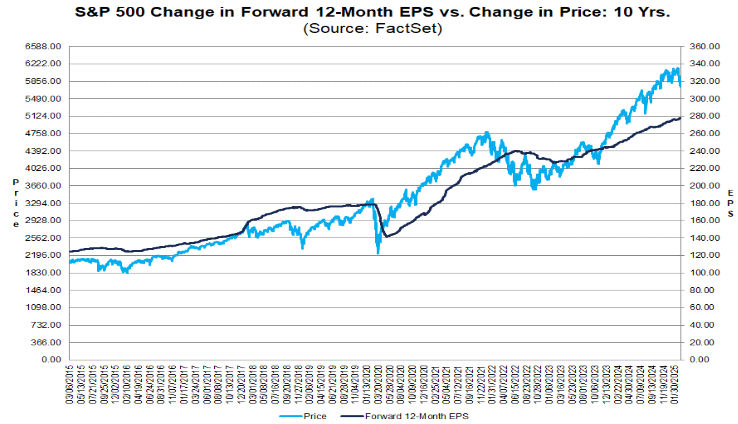
S&P 500 Current Valuations
The current earnings forecast by equity analysts estimate the earnings potential for S&P 500 companies to be around $280 which translates to a price to earnings ratio of 20.7 at the current S&P 500 price level. This is above the 5 year and the 10 year averages. The market still remains pricey.
Disclosures
- Trillium Square Advisors LLC is a registered investment adviser offering advisory services in the state of North Carolina and in other jurisdictions where exempted. Registration as an investment adviser does not imply a certain level of skill or training, and the content of this communication has not been approved or verified by the United States Security and Exchange Commission or by any state securities authority.
- Information presented is for educational purposes only and does not intend to make an offer or solicitation for the sale or purchase of any specific securities, investments or investment strategies. Market data, articles and other content in this presentation are based on generally available information and are believed to be reliable. Trillium Square does not guarantee the accuracy of the information contained in this presentation. The information is of a general nature and should not be construed as investment advice and relied upon in making investment decisions.
- Investments involve risk and are never guaranteed. Be sure to first consult with a qualified financial adviser before implementing any strategies discussed herein.
- Past performance is not indicative of future performance.
- The content of this communication and any accompanying documents are not to be copied, excerpted or distributed without express written permission of the firm. Any other use beyond its author's intent, distribution or copying of the contents of this presentation is strictly prohibited. Nothing in this document is intended to be legal, accounting, or tax advise, and is for informational purposes only.
- Hypothetical performance results have many inherent limitations. No representation is being made that any account will or is likely to achieve profits or losses similar to those shown. In fact, there are frequently sharp differences between hypothetical performance results and the actual results subsequently achieved by any particular investment strategy. Hypothetical performance for illustration purposes only.
- Trillium Square will provide all prospective clients with a copy of our current Form ADV, Part 2A (Disclosure Brochure) upon request. At anytime you can view our current Form ADV, Part 2A at https://adviserinfo.sec.gov