Economic Updates for September 2024
Summary
Positive Economic Outlook Faces Uncertainty from Volatile Markets and Global Divergence
The economic news is overall positive, while the markets are experiencing higher volatility.
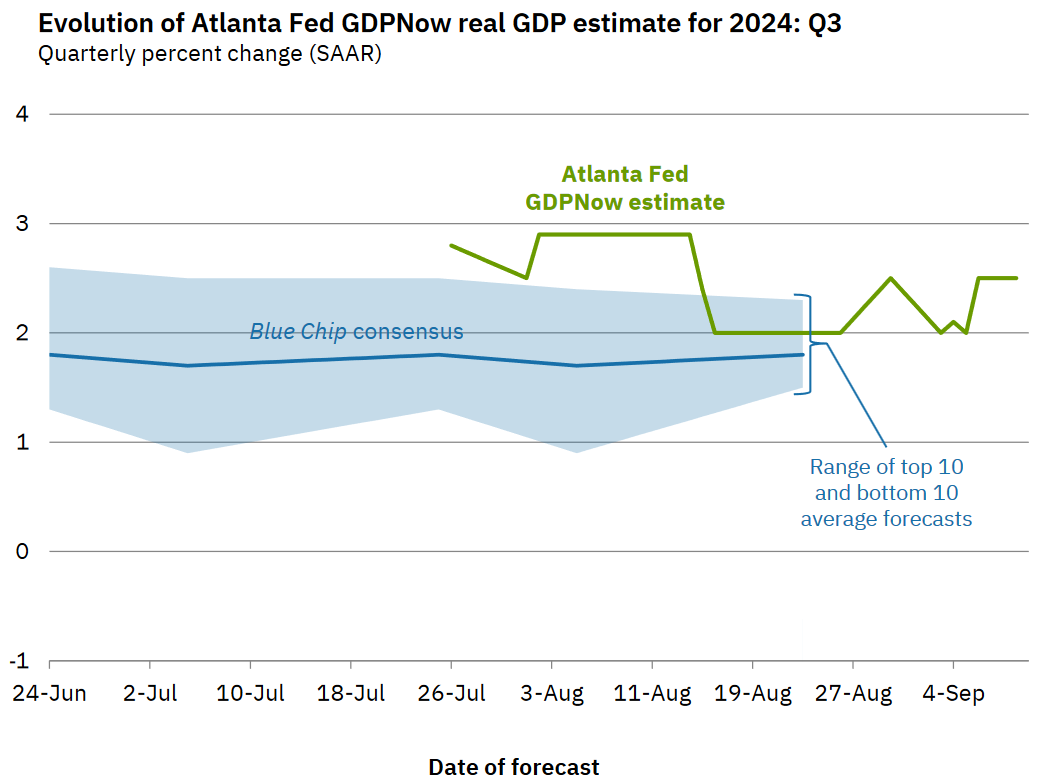
Regarding the economy, the GDP expectation for Q3 2024 looks positive. Payroll numbers are steady, and unemployment has ticked down slightly. The Services PMI still indicates expansion, suggesting a healthy—albeit gradually slowing—economy. Many are expecting the Fed to begin cutting rates in the coming months, with the possibility of rate cuts continuing for some time. This would provide relief to the housing market, small businesses across the country, and generally expand credit availability.
On the markets, the news surrounding each political candidate and their policies has caused some anxiety. The election is around the corner, with no clear frontrunner. The outcome of the election, and the extent to which the winner controls the legislature, will shape policies for the next four years. There is a wide range of potential outcomes, and until the election is settled, we must brace for volatility.
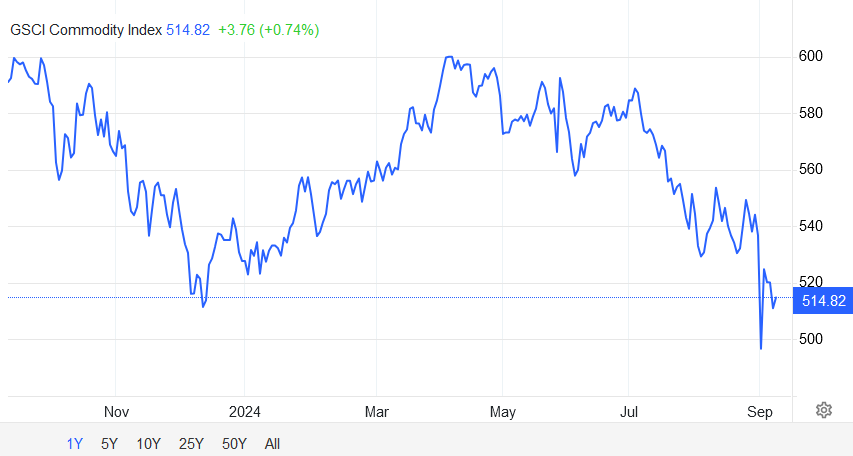
In addition to the U.S. election, central banks across the globe are diverging in their responses. While the BoJ is taking a hawkish stance, we are witnessing a continued slump in the Chinese economy and markets. Meanwhile, the Canadian central bank has already started easing. Global demand for energy has taken a backseat, while the U.S. dollar has also been weakening. This is likely to result in increased cross-asset volatility, similar to what we saw in early August.
Broad Indicators
Atlanta GDP NowCast
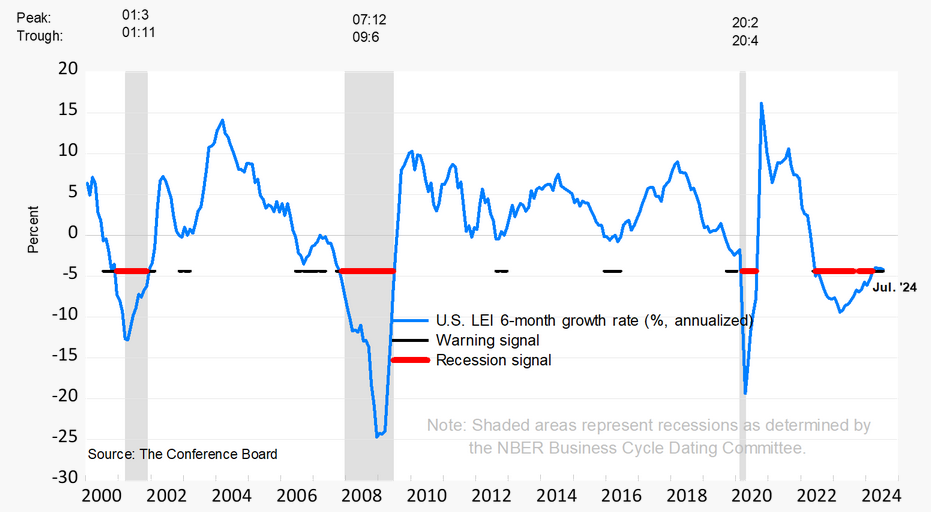
Conference Board's Leading Economic Indicator
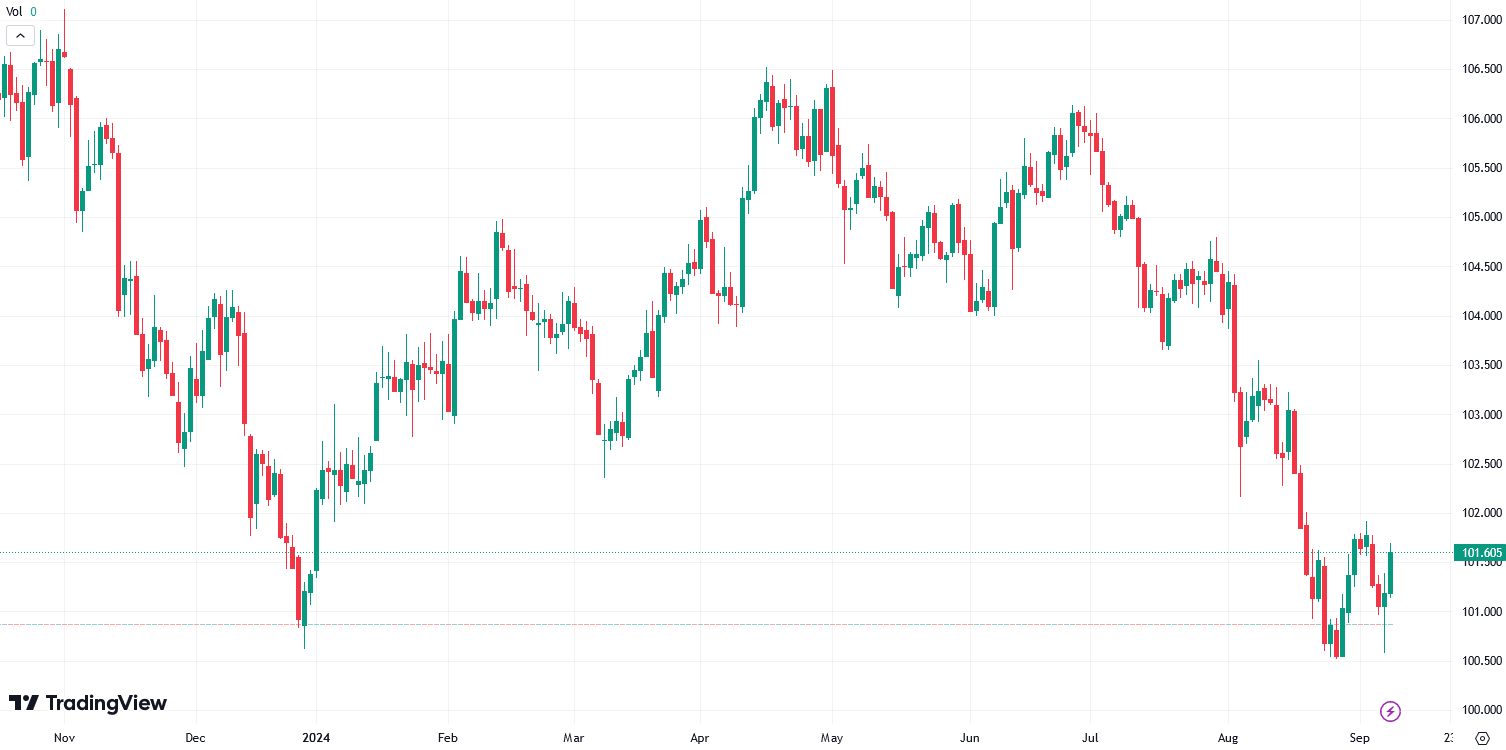
US Dollar Index
Commodities
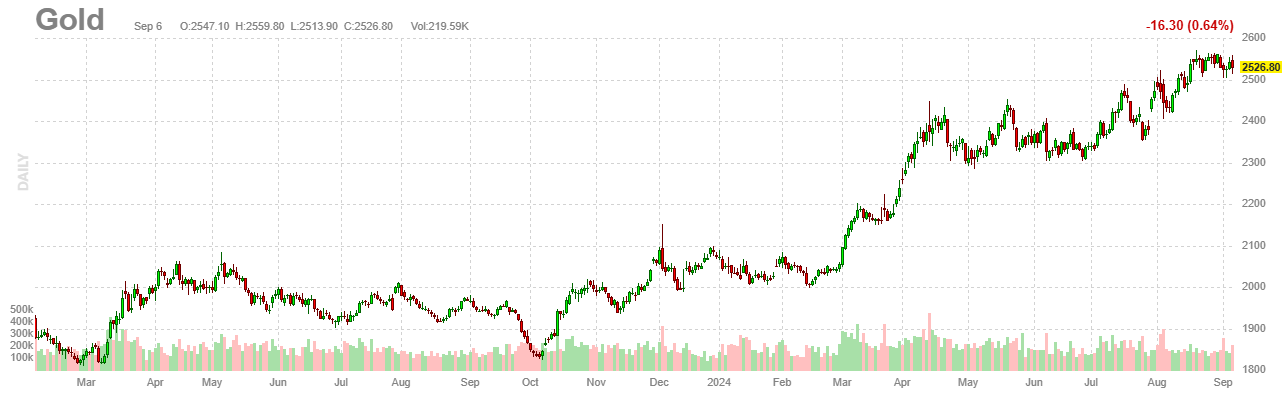
Gold
Gold has been an exceptional performer this year. Slowing Chinese economy and booming Indian economy has certainly contributed. In addition, Central banks around the world have started preferring Gold to US Treasuries lately.
Bitcoin
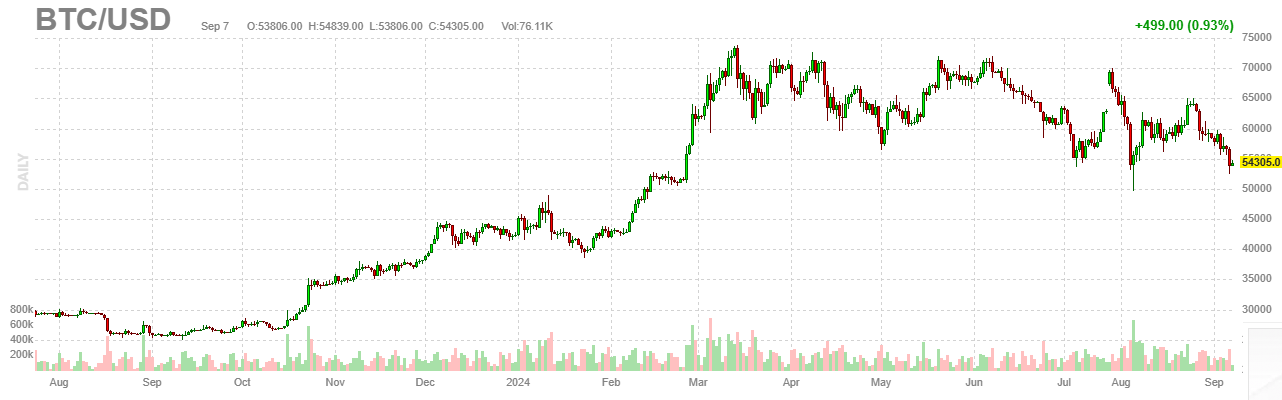
It is interesting to see that Gold has diverged from BitCoin. BitCoin remains under pressure and has behaved more like a risk asset such as tech stocks. The recent Yen carry trade unwind has impacted BitCoin.
Inflation
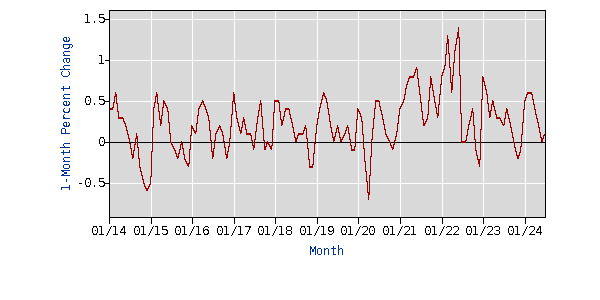
CPI Month over Month
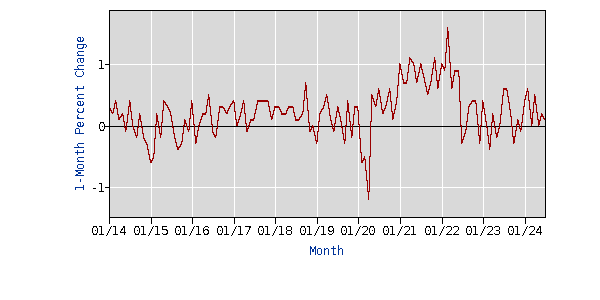
PPI Month over Month
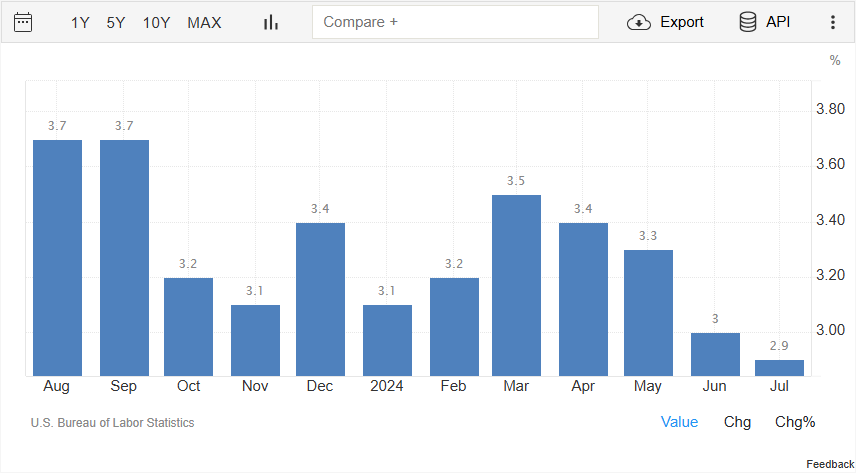
Reported Year over Year Inflation Rate
CPI Components
 CPI Components Last Month
Source BLS.gov Consumer Price Index
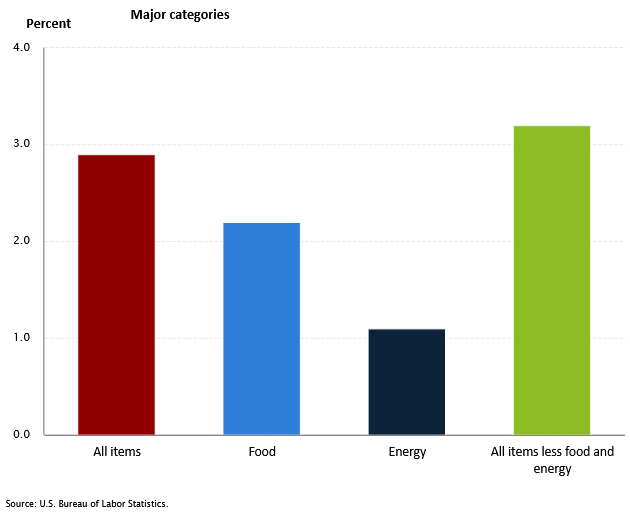
CPI Components Last Month
Source BLS.gov Consumer Price Index
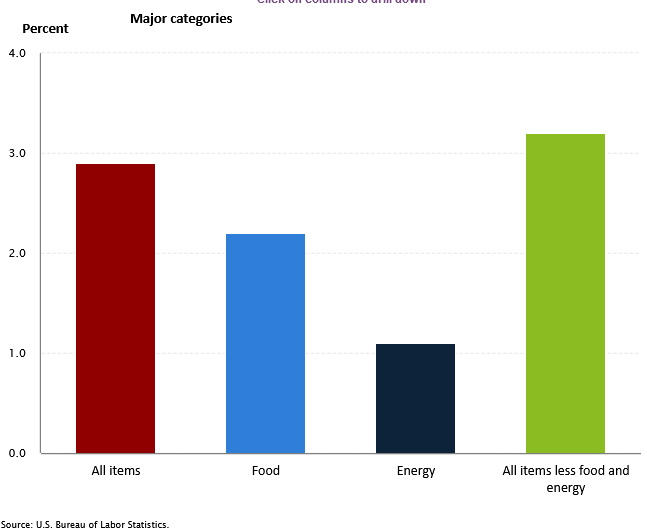 CPI Components This Month
The contributors to inflation have remained fairly consistent compared to last month. (Please note that the y-axis in both the graphs have different scales).
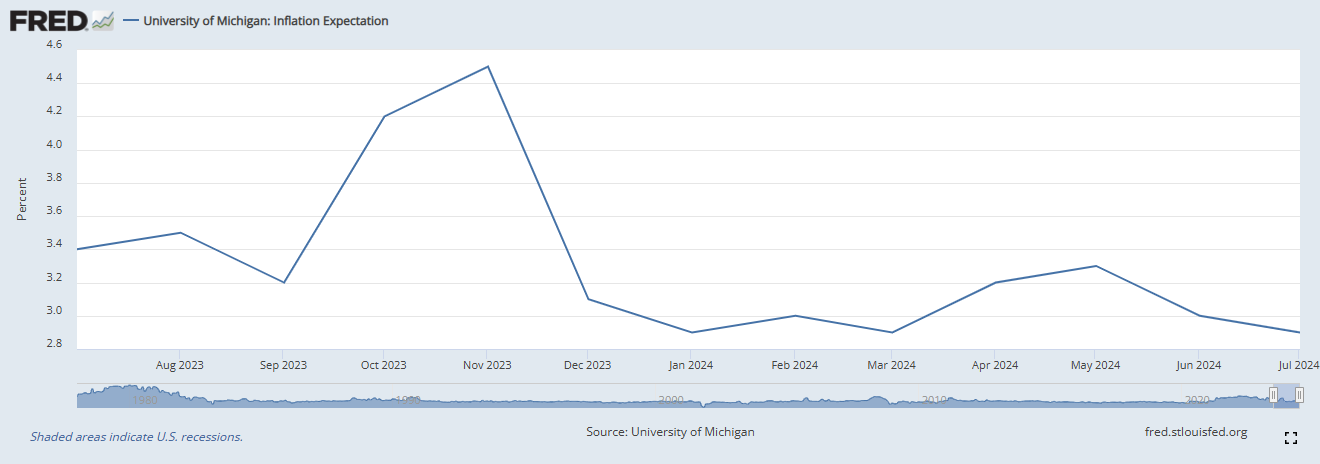
One Year Inflation Expectations
Sentiments
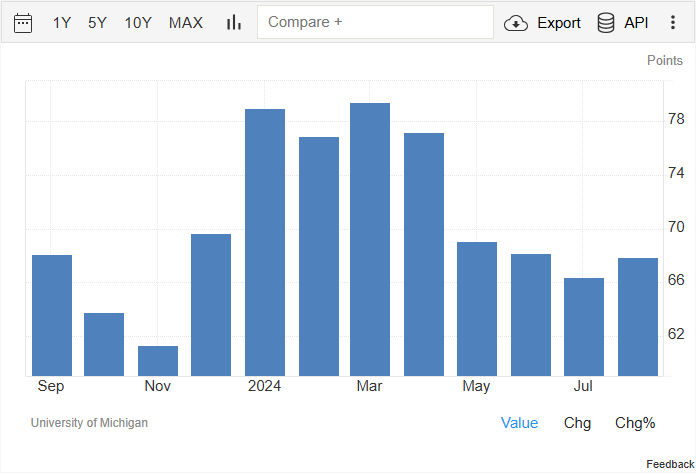
Consumer Sentiments
Investor Sentiments
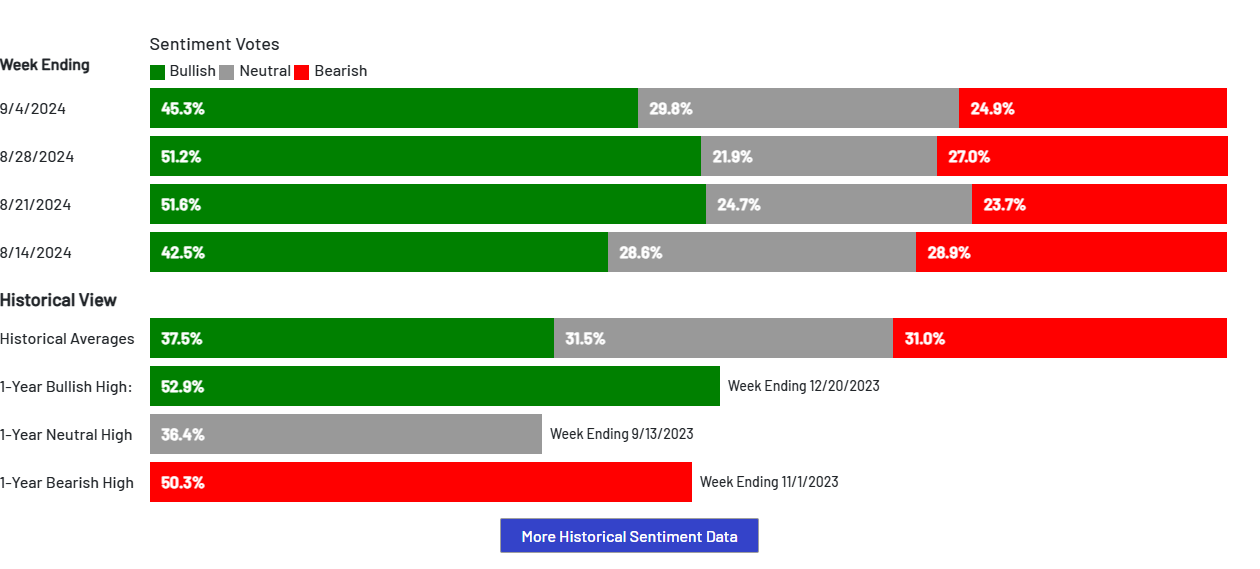
The AAII sentiment remains optimistic rebounding from the lows early last month.
GDP Factors
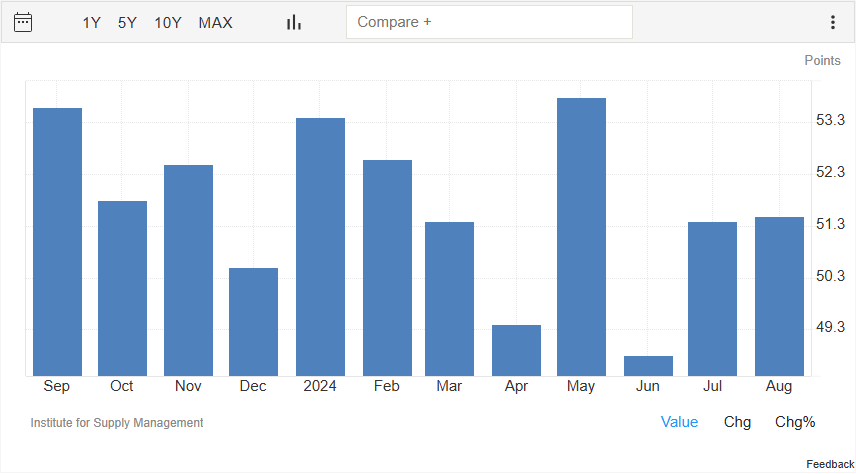
Manufacturing PMI
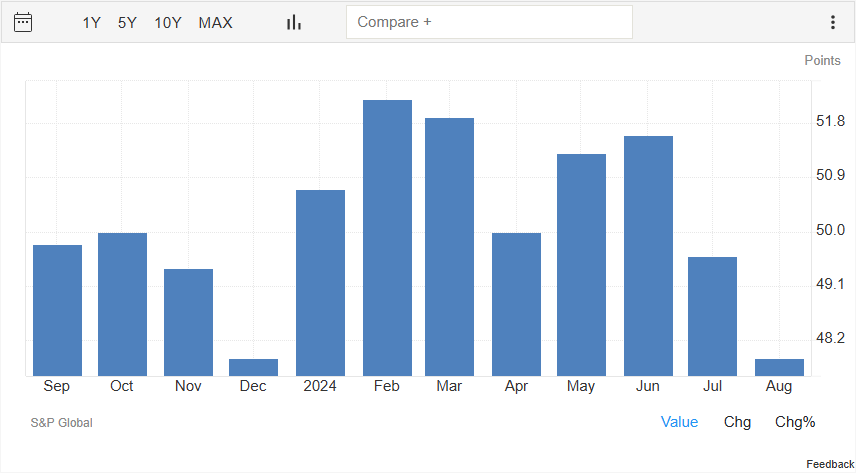
Services PMI
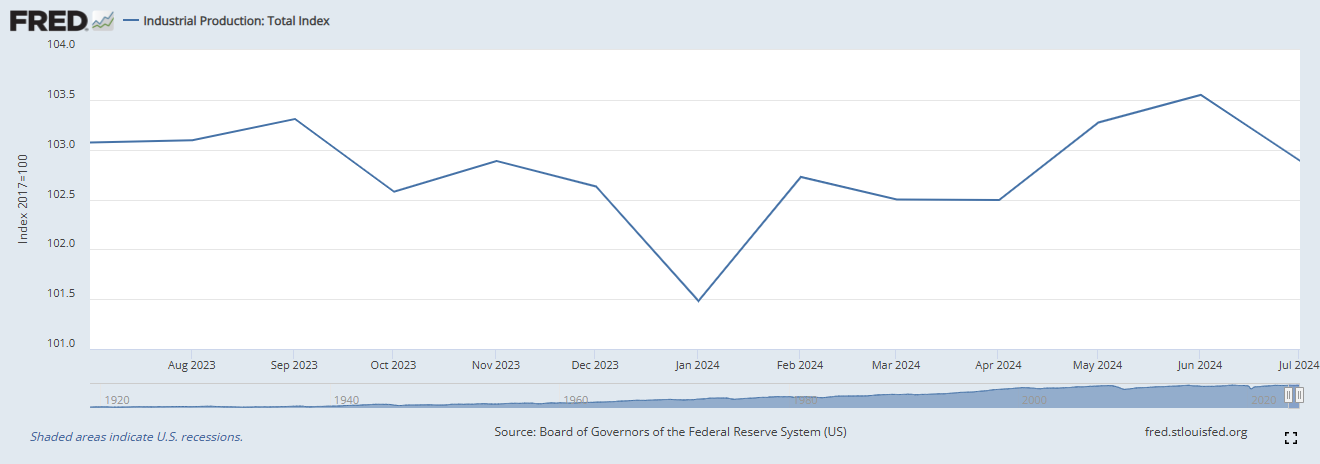
Industrial Production
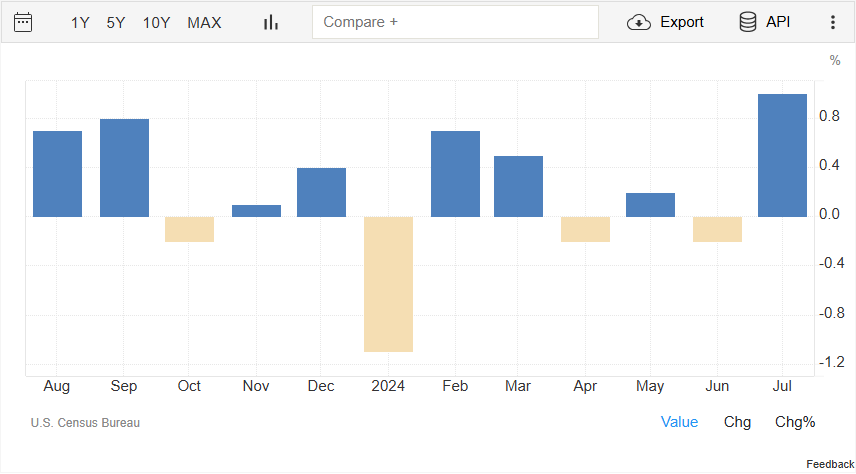
Retail Sales
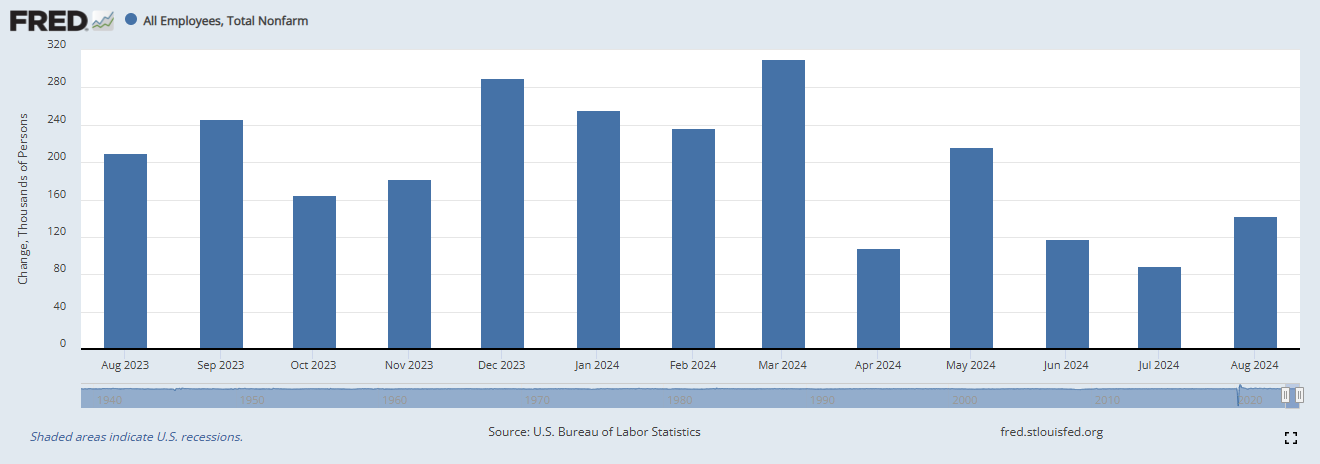
Non-farm Payrolls
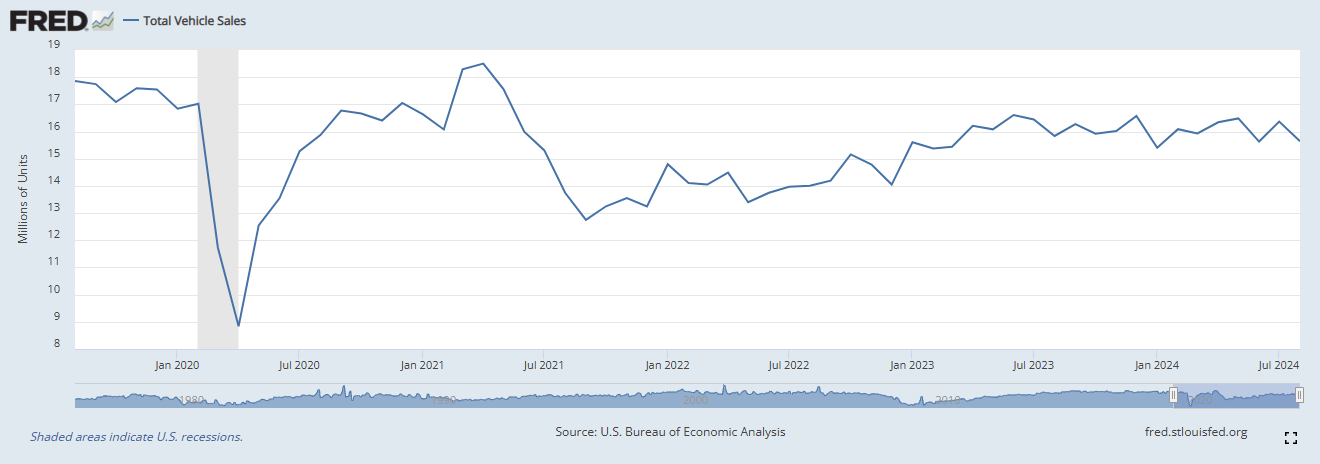
Total Vehicle Sales
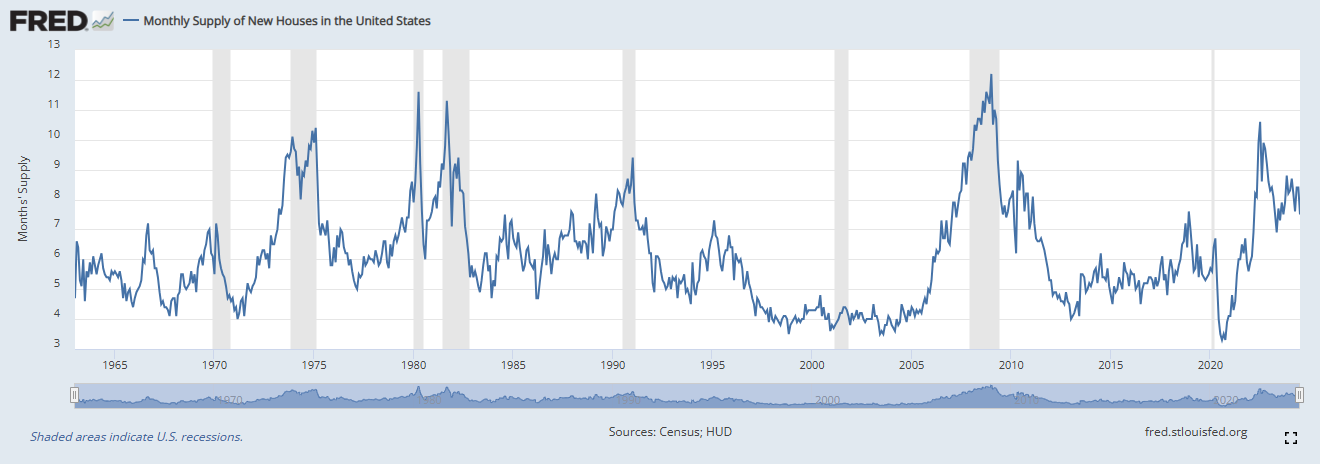
US New Home Sales
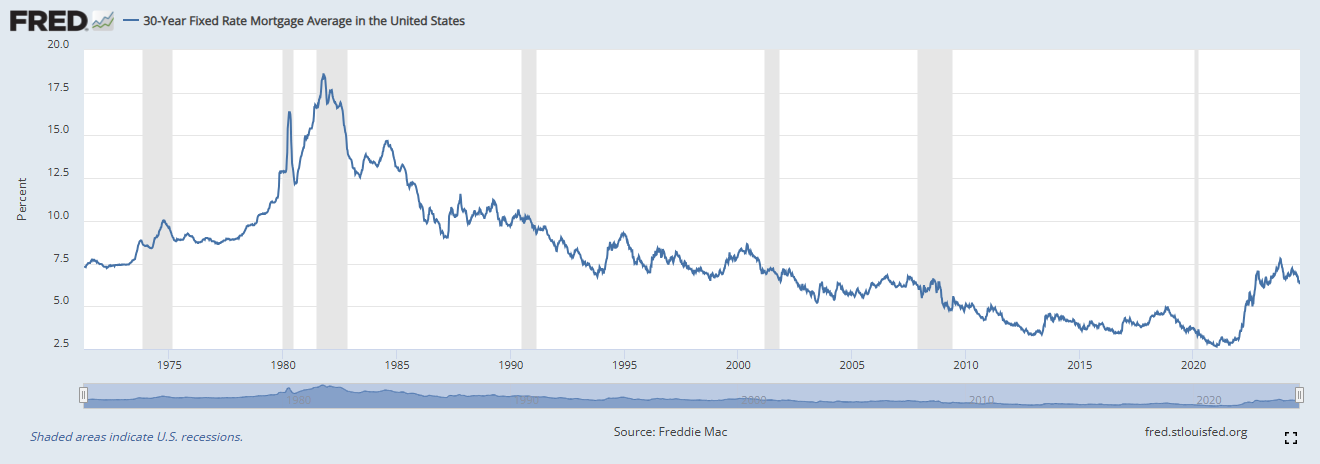
30 Year Fixed Mortgage Rates
The mortgage rates have followed the 10-year Treasury yield lower over the last few weeks. This is probably in anticipation to the rate cuts.
Employment Indicators
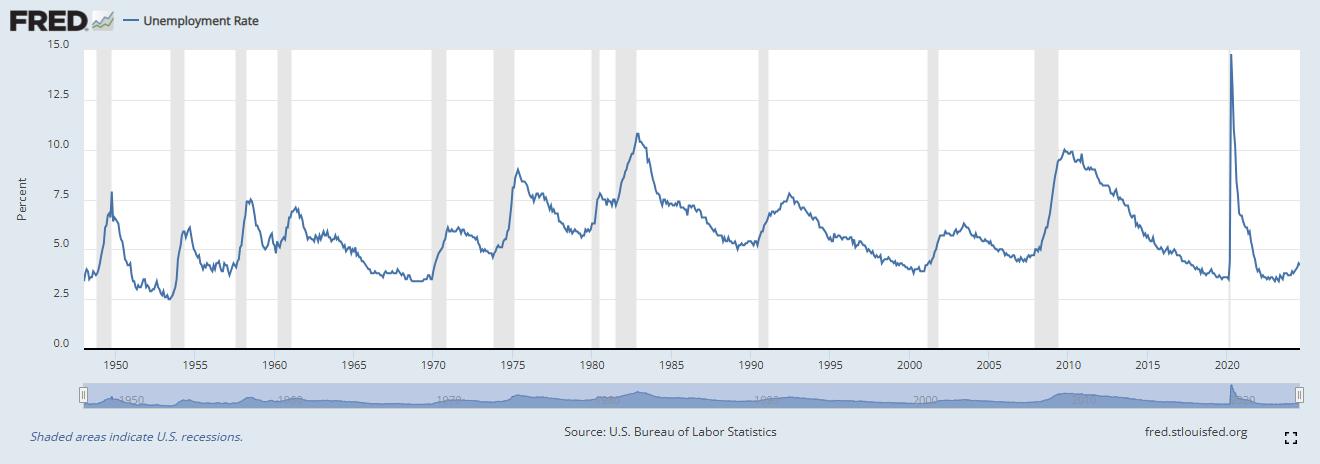
Historical Unemployment Rate
US Jobless Claims
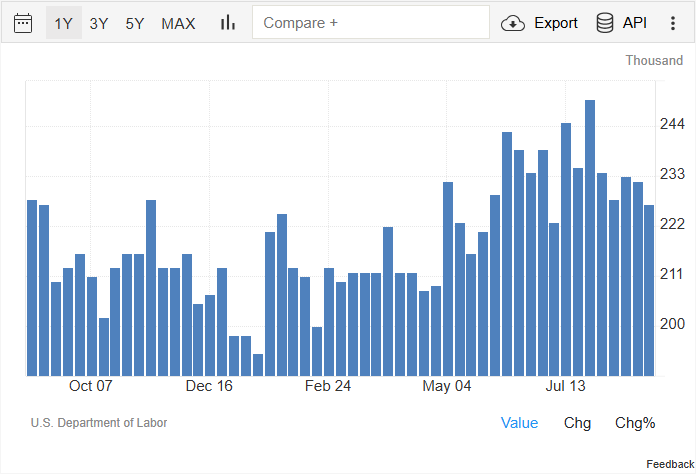
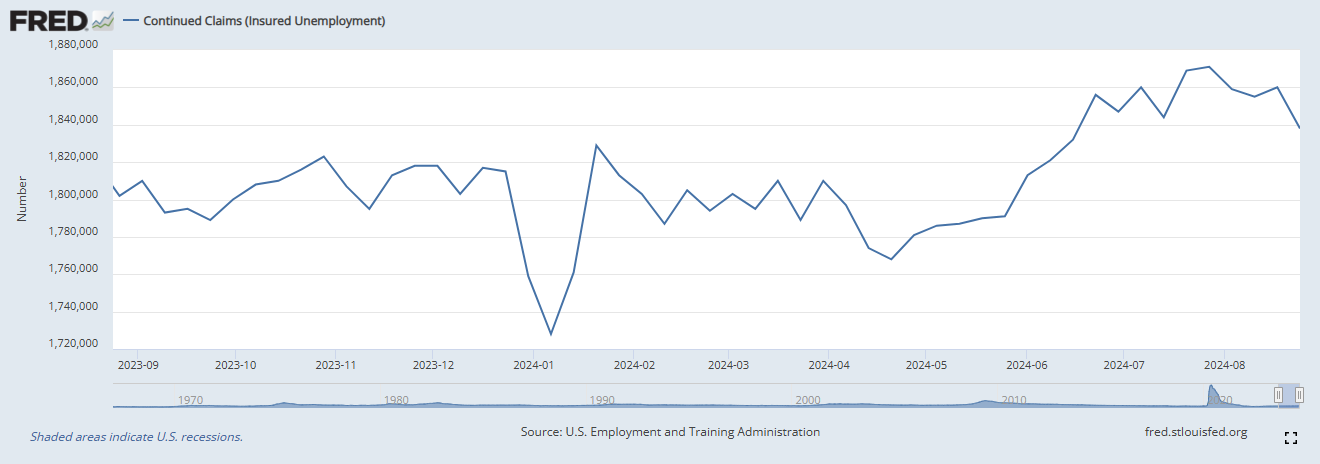 This chart will be the first indicator of a telltale sign that unemployment is increasing. As you see the continuing
jobless claims number rise, it implies the people who lost their jobs are not going back to labor force fast enough
and the unemployment rate is starting to creep higher. Over the last couple of weeks, it has trended lower allaying any
fears of an imminent recession.
This chart will be the first indicator of a telltale sign that unemployment is increasing. As you see the continuing
jobless claims number rise, it implies the people who lost their jobs are not going back to labor force fast enough
and the unemployment rate is starting to creep higher. Over the last couple of weeks, it has trended lower allaying any
fears of an imminent recession.
Market Indicators
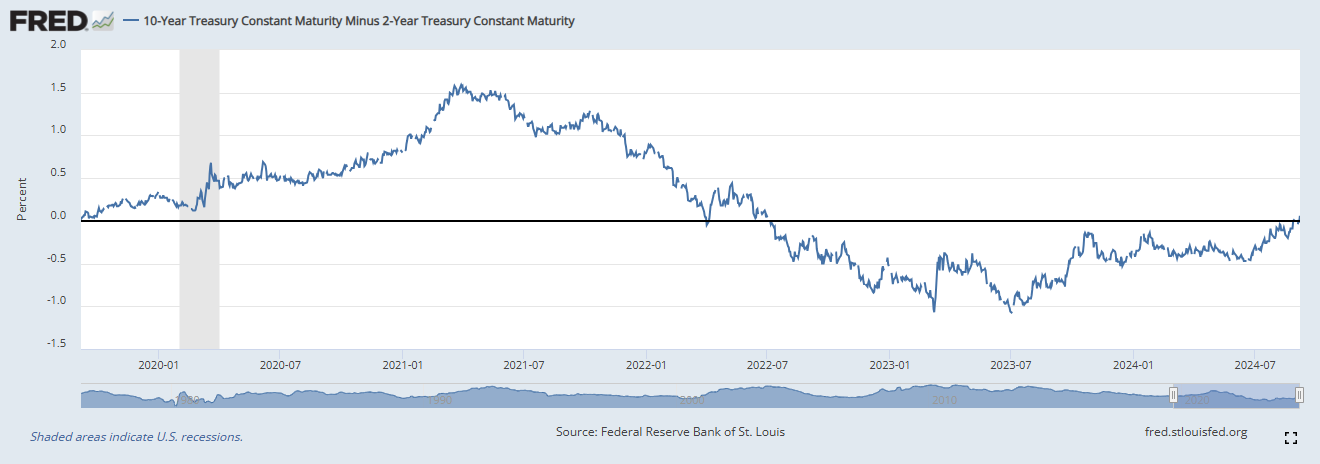
Yield Curve Inversion
Yield Curve - then and now
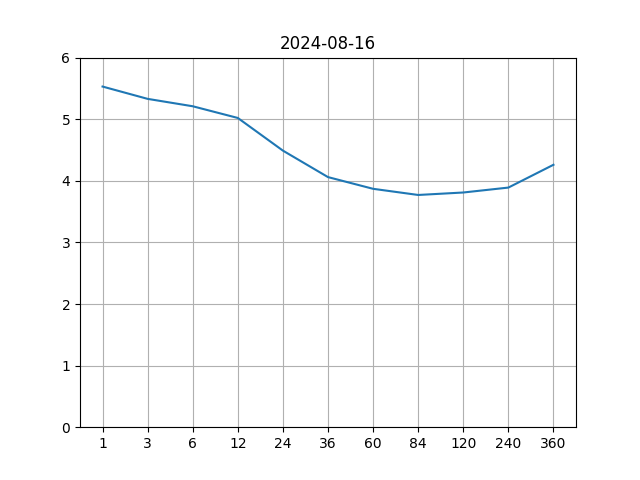 Yield curve - Then
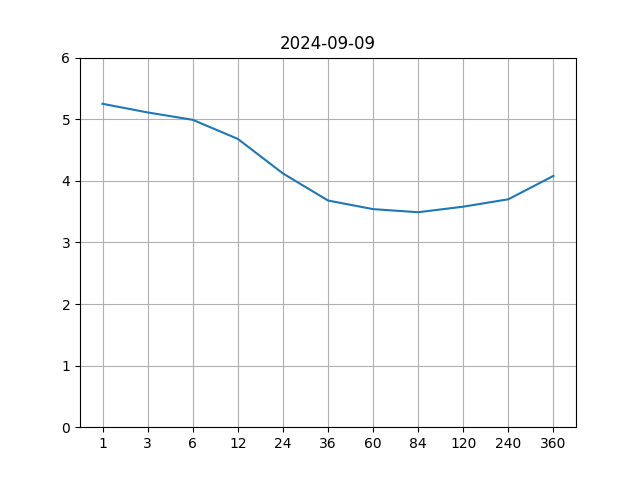 Yield curve - Now
 The market events over the last month has caused the overall yield curve to shift downwards, bull steepener. The inversion is also abating and we may see a normal yield curve by the end of the year.
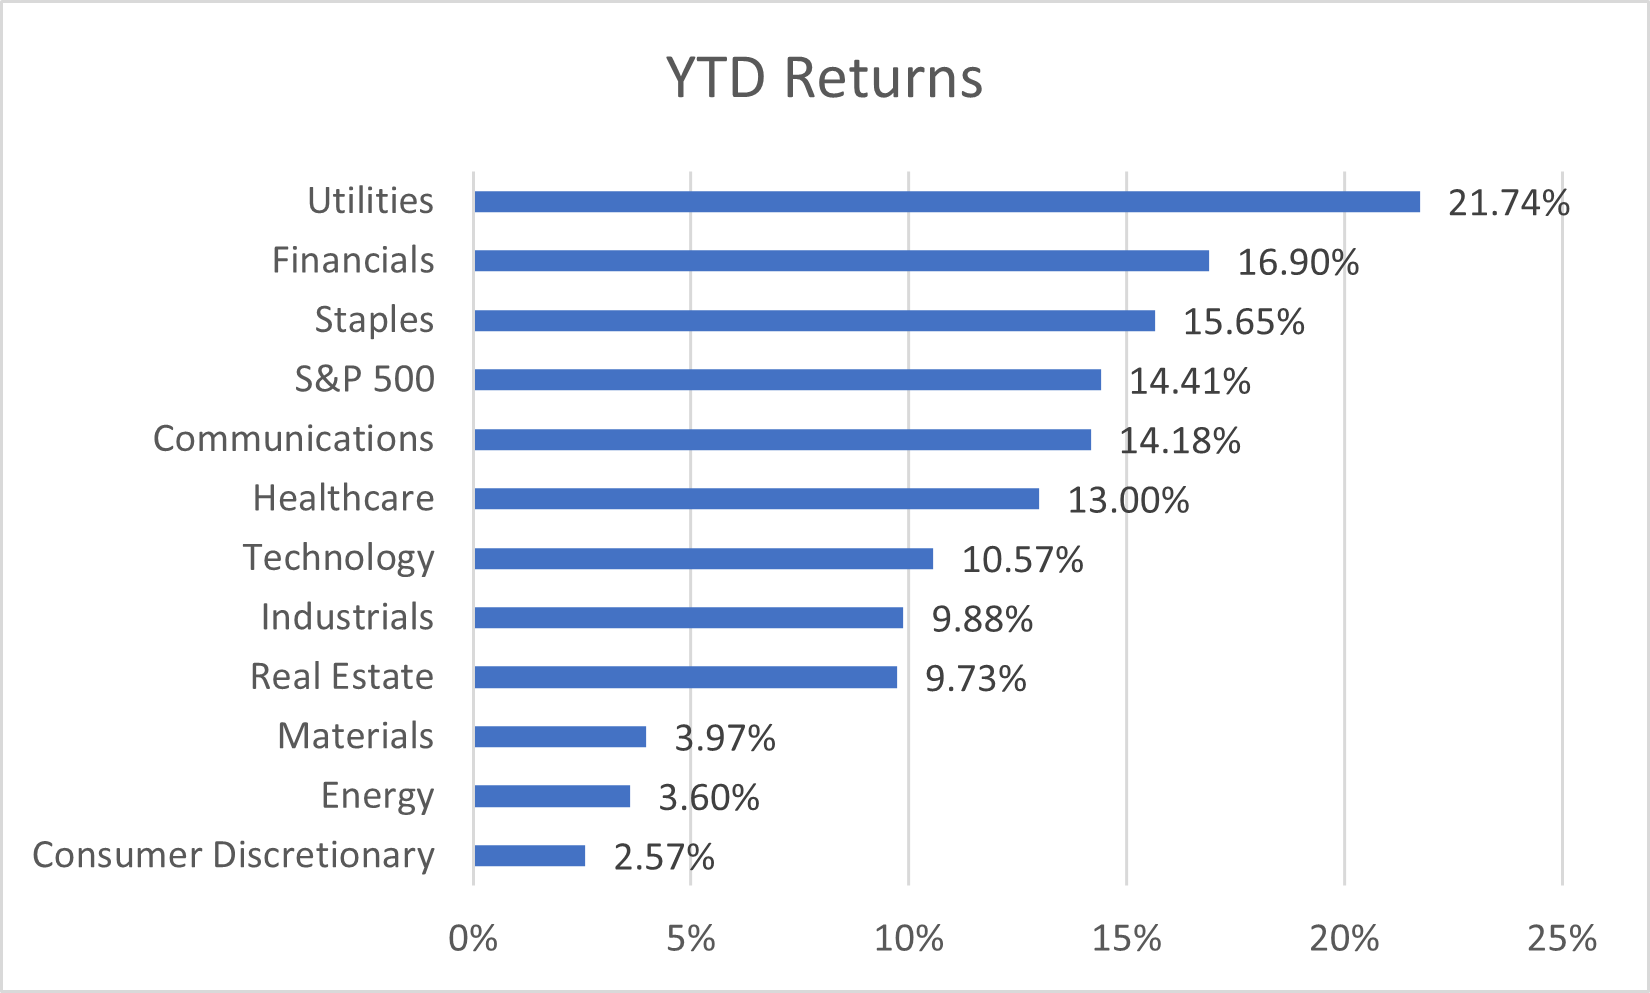
Market Sectors
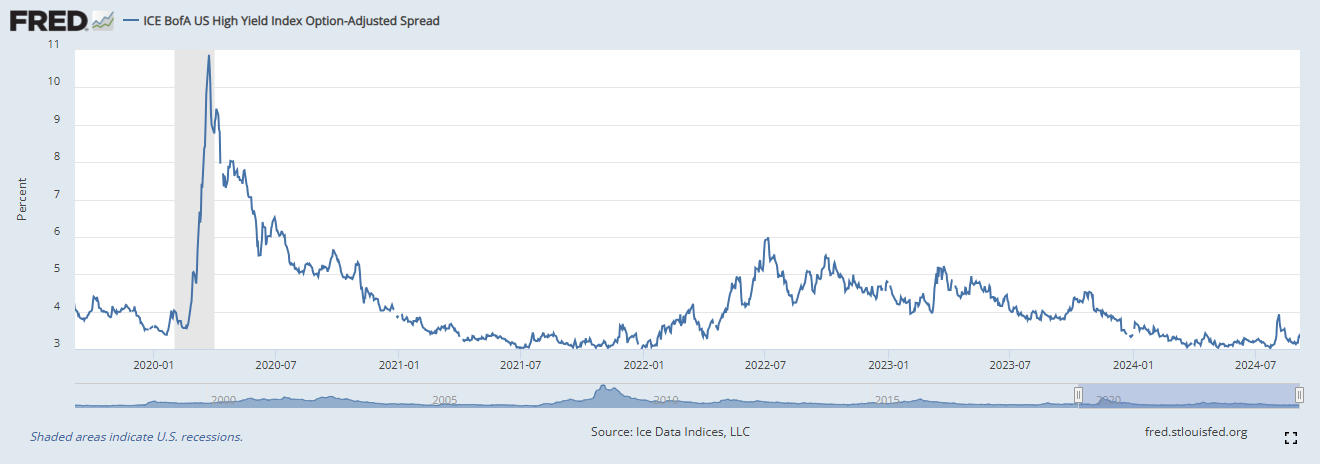
High Yield Index Options-Adjusted Spread
If the economy were to enter a recession, it is likely that some of the companies will struggle to keep up with their debt payments causing their credit spread to widen. This indicator shows how the credit spreads have been behaving well so far even in the face of the Yen carry trade unwind.
The tight spread indicate that the soft landing narrative is actually playing out.
Put Call Ratio
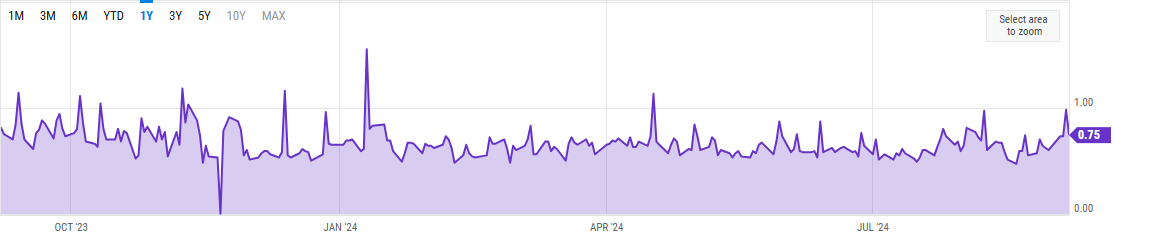
A spike in put / call ratio indicates that investors are very apprehensive about a sudden fall in the equity markets. In August/September, we have not seen any interesting activities outside a couple of days in early August due to the Yen carry trade unwind.
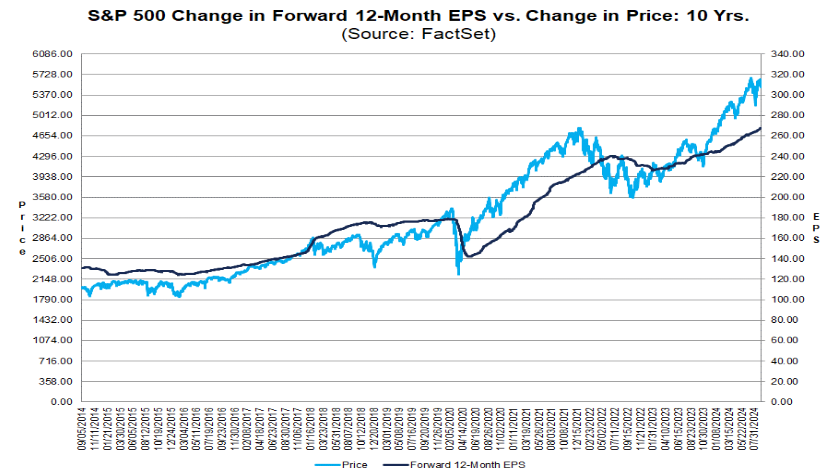
S&P 500 Current Valuations
The current earnings forecast by equity analysts estimate the earnings potential for S&P 500 companies to be around $265 which translates to a price to earnings ratio of 20.7 at the current S&P 500 price level. This is above the 5 year and the 10 year averages. The market is looking pricier by the day.
Diclosures
- Trillium Square Advisors LLC is a registered investment adviser offering advisory services in the state of North Carolina and in other jurisdictions where exempted. Registration as an investment adviser does not imply a certain level of skill or training, and the content of this communication has not been approved or verified by the United States Security and Exchange Commission or by any state securities authority.
- Information presented is for educational purposes only and does not intend to make an offer or solicitation for the sale or purchase of any specific securities, investments or investment strategies. Market data, articles and other content in this presentation are based on generally available information and are believed to be reliable. Trillium Square does not guarantee the accuracy of the information contained in this presentation. The information is of a general nature and should not be construed as investment advice and relied upon in making investment decisions.
- Investments involve risk and are never guaranteed. Be sure to first consult with a qualified financial adviser before implementing any strategies discussed herein.
- Past performance is not indicative of future performance.
- The content of this communication and any accompanying documents are not to be copied, excerpted or distributed without express written permission of the firm. Any other use beyond its author’s intent, distribution or copying of the contents of this presentation is strictly prohibited. Nothing in this document is intended to be legal, accounting, or tax advise, and is for informational purposes only.
- Hypothetical performance results have many inherent limitations. No representation is being made that any account will or is likely to achieve profits or losses similar to those shown. In fact, there are frequently sharp differences between hypothetical performance results and the actual results subsequently achieved by any particular investment strategy. Hypothetical performance for illustration purposes only.
- Trillium Square will provide all prospective clients with a copy of our current Form ADV, Part 2A (Disclosure Brochure) upon request. At anytime you can view our current Form ADV, Part 2A at https://adviserinfo.sec.gov