Economic Updates for December 2022
Summary
-
FED appears to have peaked in their hawkishness
- They are now targeting a level for FED Funds Rate instead of incremental increases (5.1% by end of 2023). We are already at 4.5%, not too far from this level.
- In spite of this, their language is still very hawkish.
-
Recession Warning
- Analysts are starting to expect lower earnings guidance for 2023 from reporting companies in January.
- This is the most expected recession in history, potentially making it a mild one.
- Closely watching job postings numbers and non-farm payrolls; Tech seeing layoffs.
Broad Indicators
Atlanta GDP NowCast
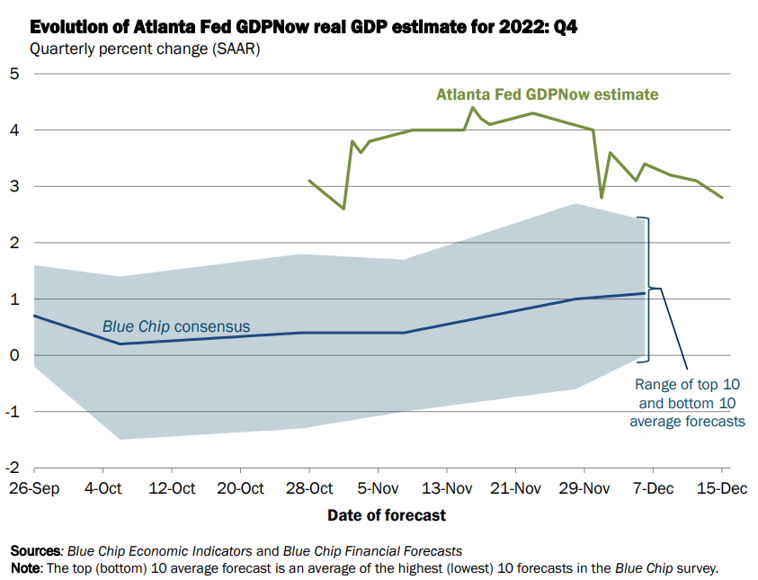
GDP is projected to be 2+% for Q4 2022. It is hard to fathom such a positive number given we are expecting a recession!
US Dollar Index
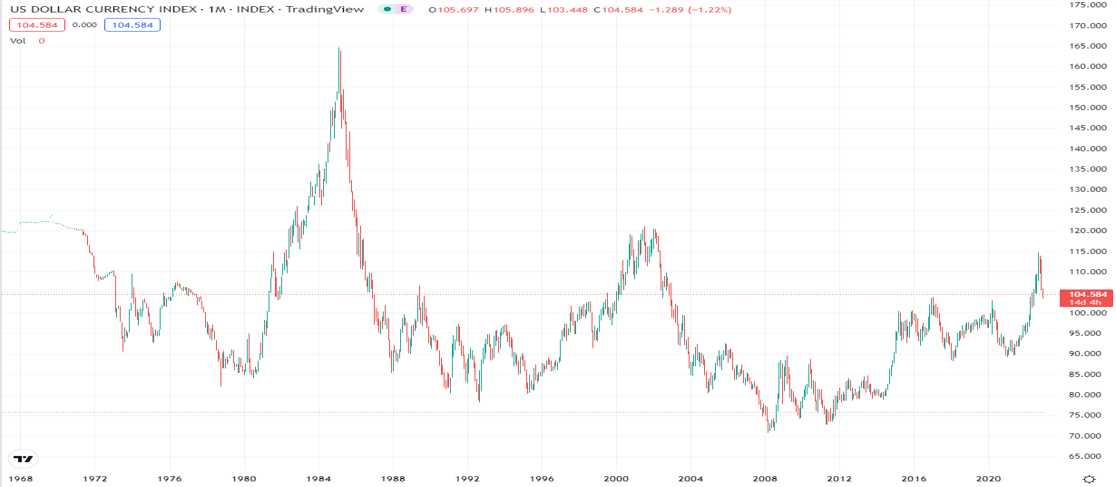
Dollar seems to have peaked.
Commodities
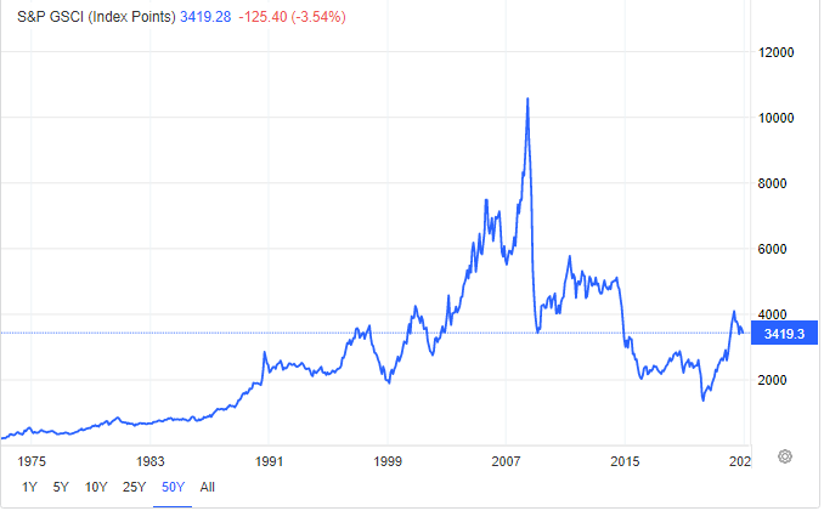
Commodities still climbing but are taking a short break.
Gold
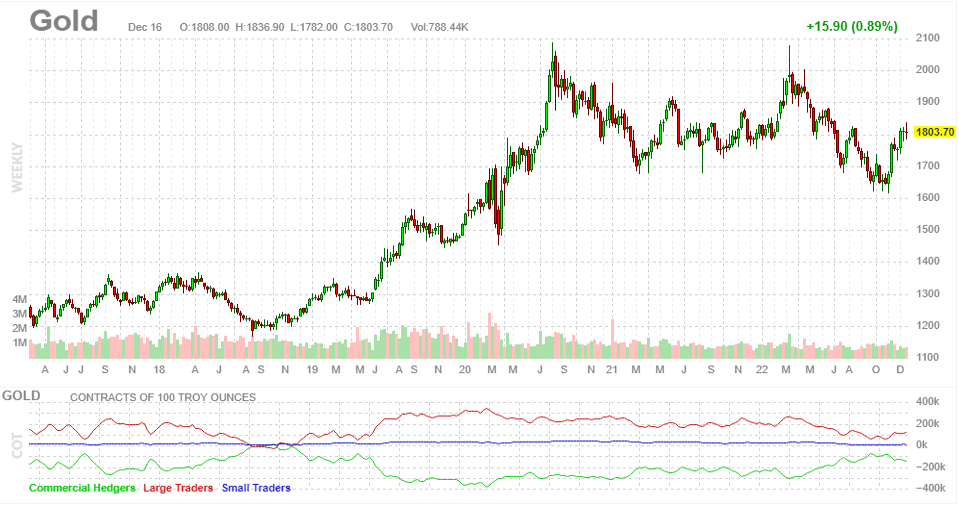
Gold is starting to see some positive momentum lately. As the yield has somewhat stabilized, the higher
inflation level is perhaps attracting investors to gold.
BitCoin
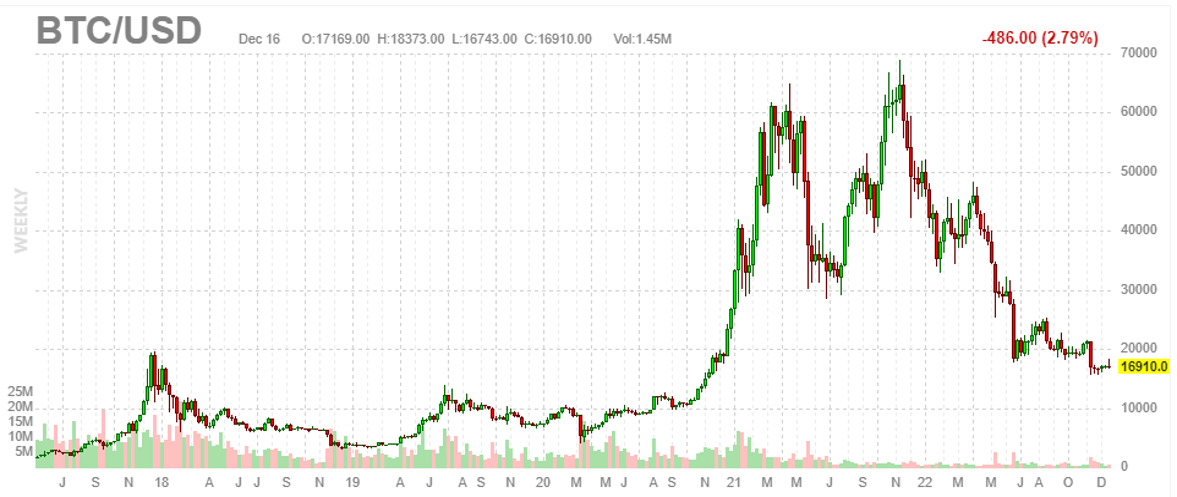
BitCoin is still flat and not following gold. The inflation theory that was supposed to be a tailwind
for BitCoin seems not to be working. My guess is that the crypto debacle from FTX blowup is causing investors to
be extra cautious.
Inflation
CPI Month over Month
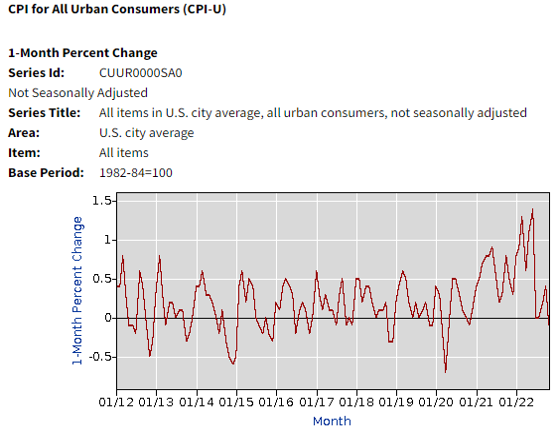
Inflation is heading in the right direction. Hope it continues to go down in the coming months. Historically,
inflation is notorious to bounce back and hence it is worth keeping a close eye.
PPI Month over Month
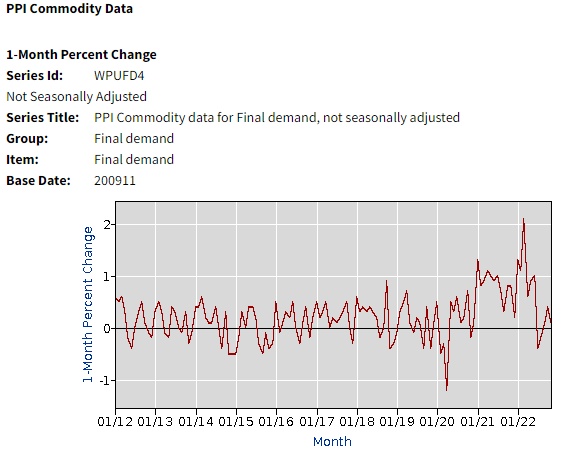
PPI has also moderated, which is a positive for goods prices. We hope the services inflation also moderates
in the coming months.
NYFed Global Supply Chain Pressure Index
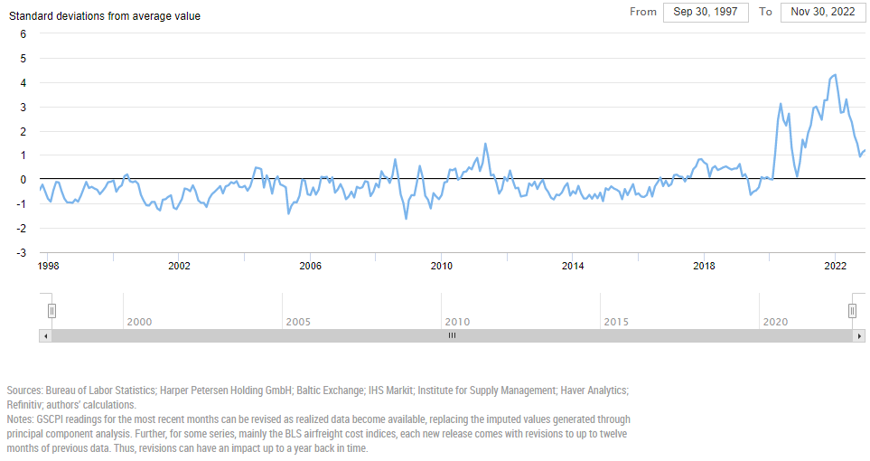
The key supply chain bottlenecks seem to be resolving nicely. The Supply Chain Pressure Index is reverting to its mean.
Reported Year over Year Inflation Rate
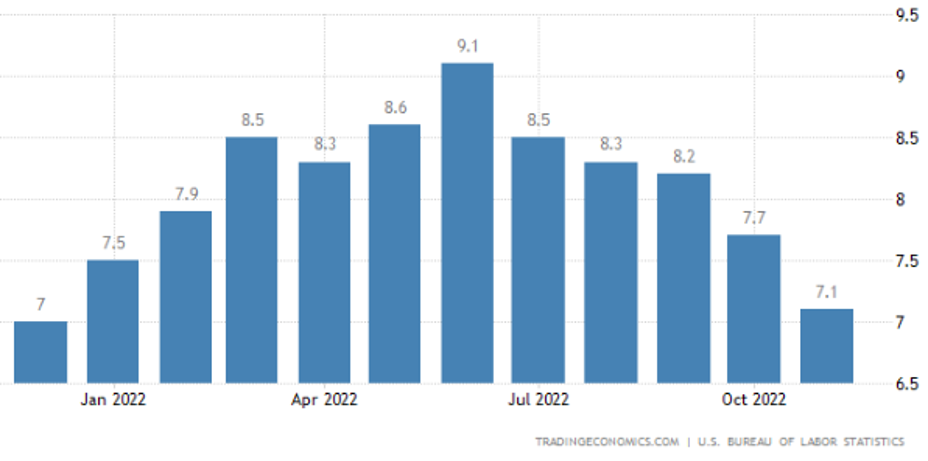
This is the headline inflation number that everyone talks about. Currently, it is reported at 7.1%, definitely heading in the
right direction.
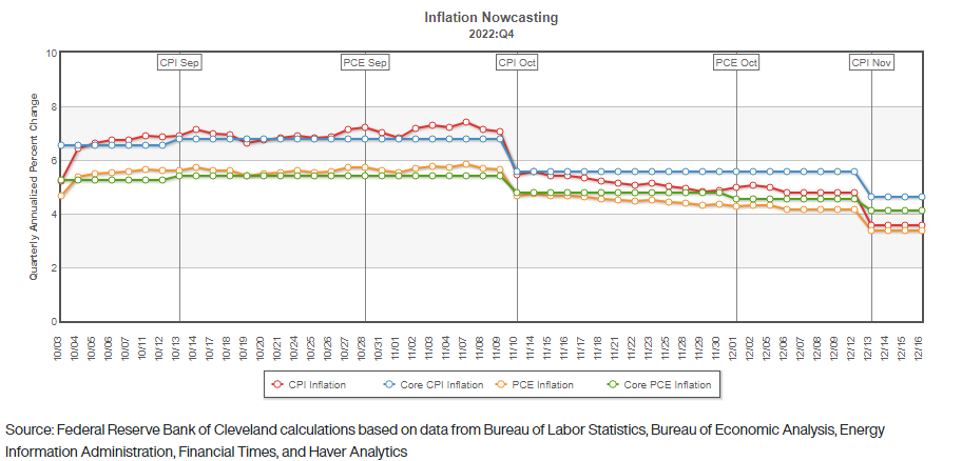
Inflation NowCast
Inflation Nowcast indicating additional data inputs pointing to lower inflation in the coming months.
CPI Components
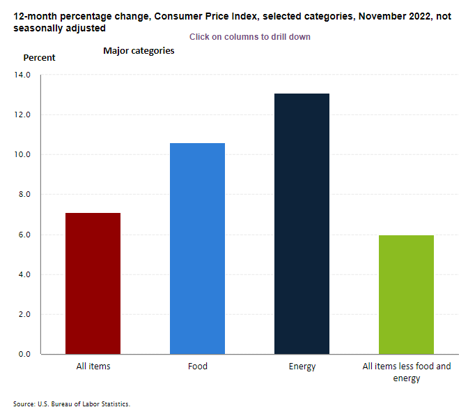 CPI Components Last Month
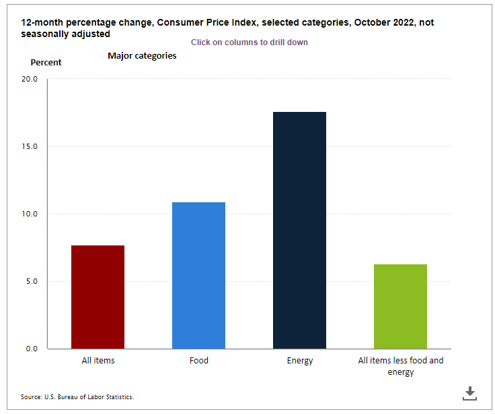 CPI Components This Month
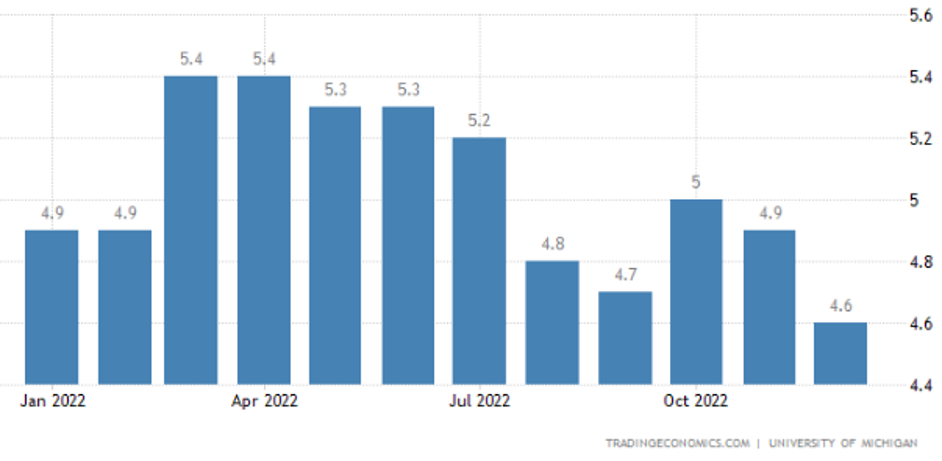
One Year Inflation Expectations
This survey data showing one year ahead inflation in a 4 handle.
5 Year, 5 Year forward Inflation Expectations
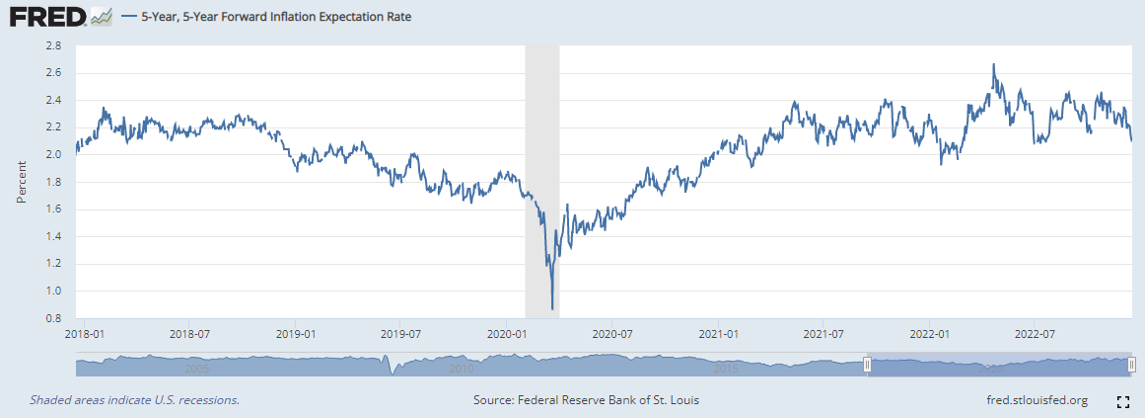
This is a market based indicator showing the inflation in 5 year forward interest rate, 5 years, is in a 2 handle.
This indicates the current inflation bout is just a blip in the radar and not an indicative of a structural change in the economy.
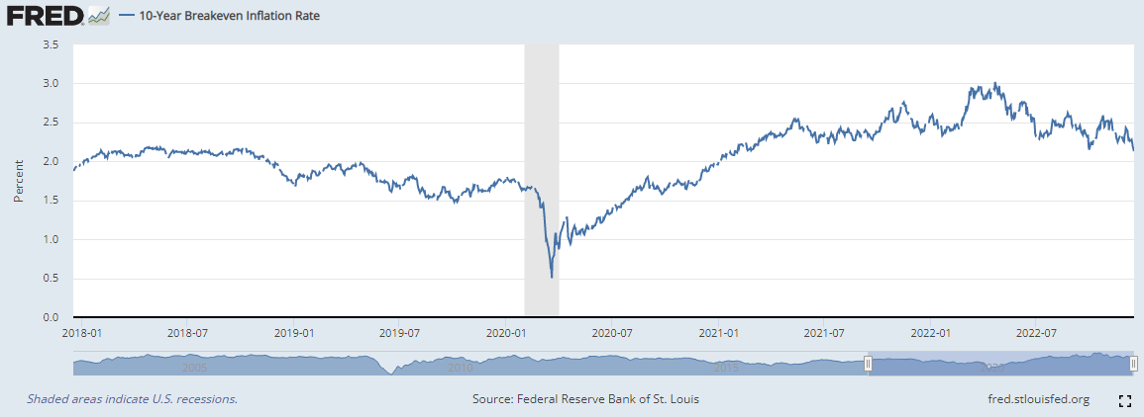
10 Year breakeven Inflation Expectations
This is another market based indicator showing the inflation 10 years from now is in a 2 handle.
This indicates the current inflation bout is just a blip in the radar and not an indicative of a structural change in the economy.
Real Yield - 10 year Treasuries
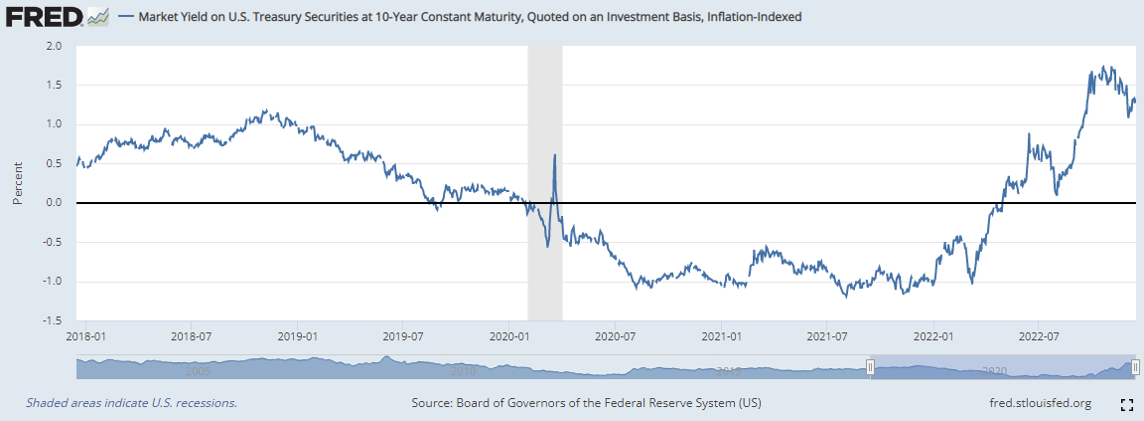
It is great to see real yields in the positive territory after a long period of being on the negative side.
This indicates the optimism in bonds where you can make some positive carry.
Sentiments
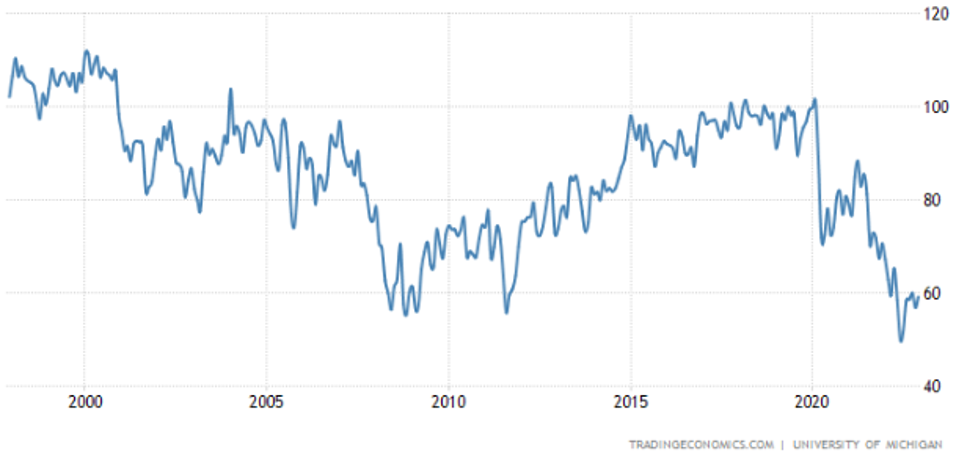
Consumer Sentiments
The survey indicator for consumer sentiments has remained weak showing consumers are not feeling too good
about the reducing inflation yet. More work needs to be done on the inflation front to get consumers to buy
durable goods again.
Investor Sentiments
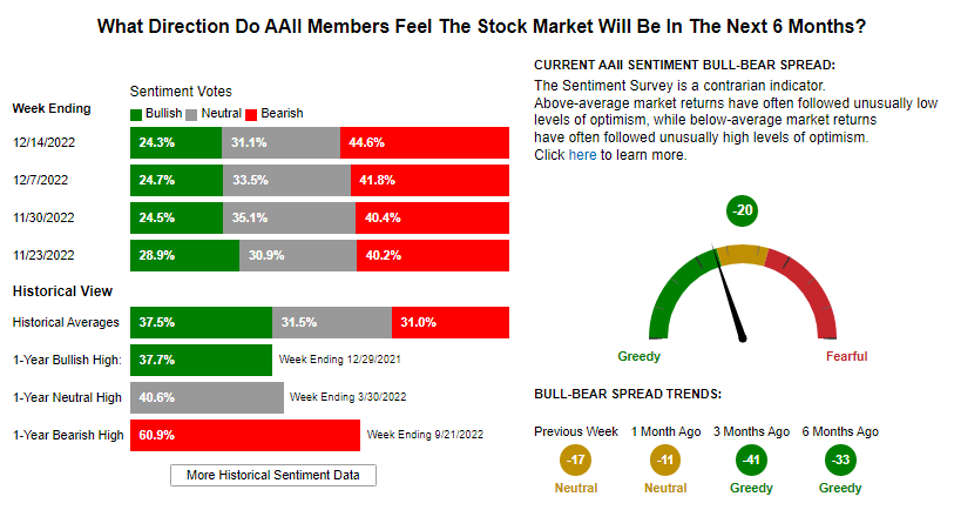
The investors have remained bearish for a while. Santa rally may be expected as the contrarian indicator
points to moderate greediness.
GDP Factors
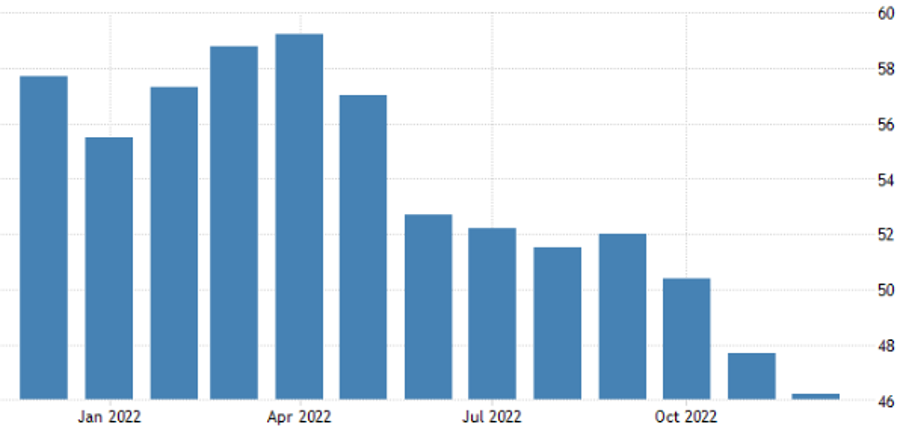
Manufacturing PMI
Manufacturing PMI reading indicates a contraction (below 50) which is not great and does not share the Atlanta
FED optimism on GDP growth. More so, this may indicate the slowdown in the economy that is yet to come.
Services PMI
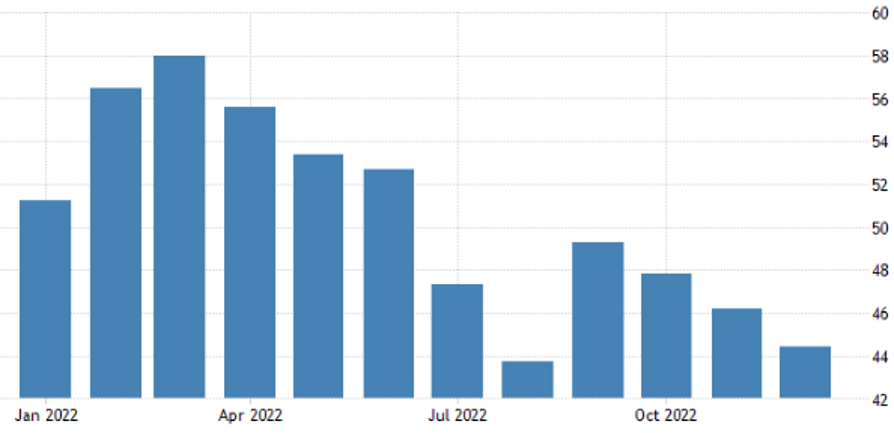
Services PMI reading is also inline with the Manufacturing PMI indicating a contraction. If we expect inflation
to sustain, it is likely to be in services which would show up here as an expansion. Fortunately for inflation, that does
not seem to be the case.
Industrial Production
Industrial Production is still positive but close to zero. We will take what positive indicator we can get and
be happy with it.
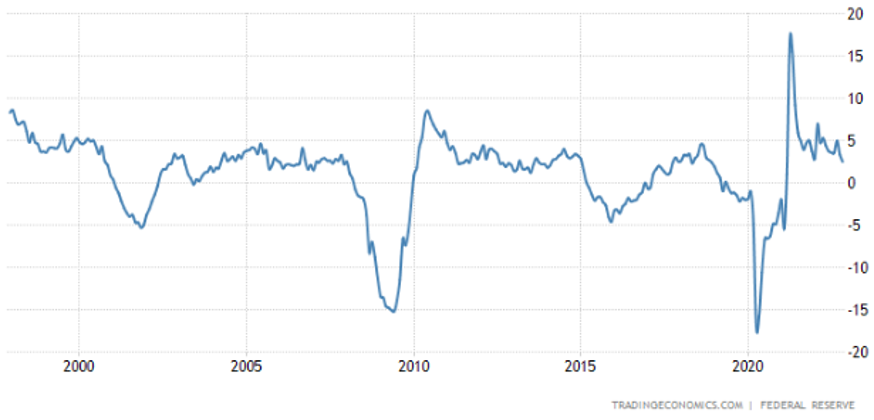
Retail Sales
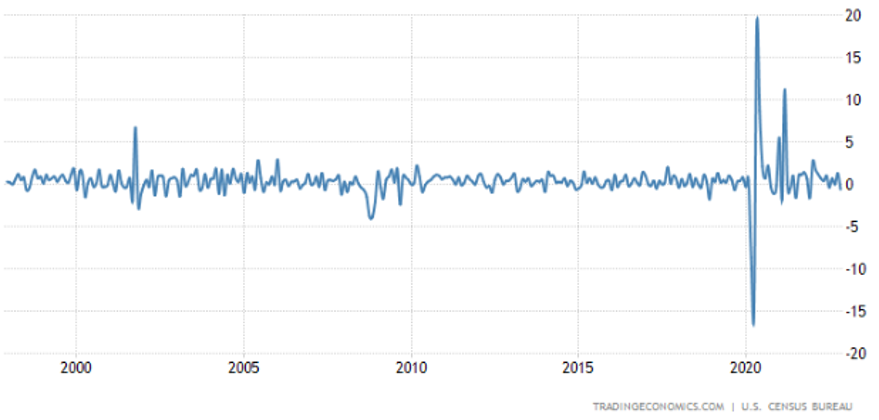
Retail Sales is very much inline with history and it is hard to infer any positive or negative signal from it.
Non-farm Payrolls
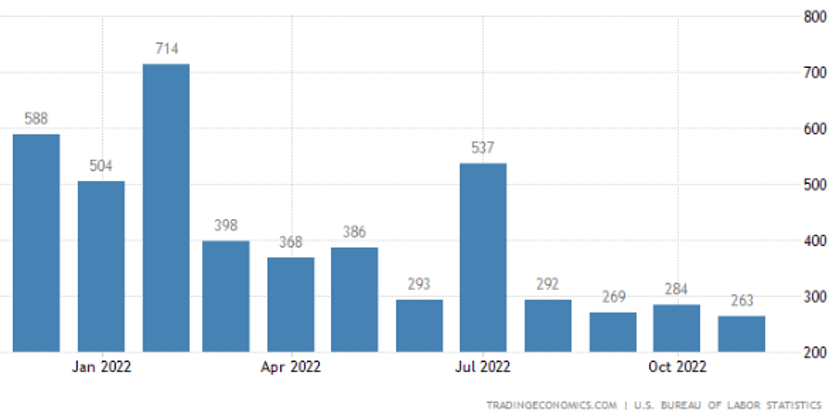
Non-farm payrolls have stubbornly been too good indicating economy is still adding jobs. We are closely reading
into this number to see if any effects of FED interest rate rises are being felt in the job market. FED is
certainly looking to see a softer number to confirm their strategy is working.
Total Vehicle Sales
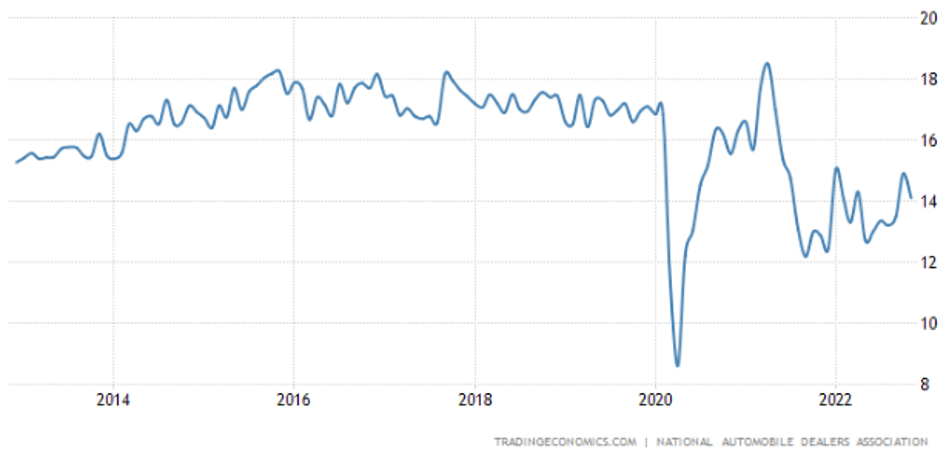
Total Vehicle sales have been moderating after the COVID frenzy. The next chart shows that the prices
for used cars have also been correcting. This is very helpful to bring down the goods inflation.
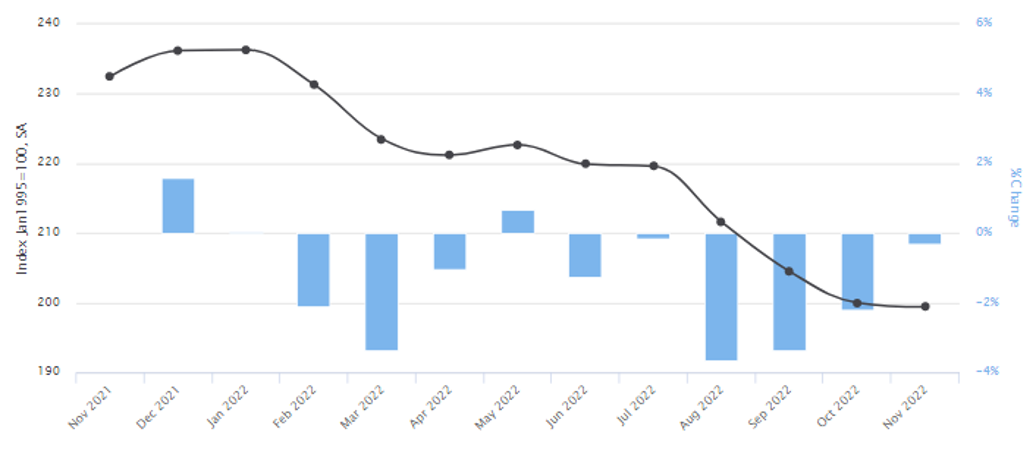
Manheim Used Car Index
Total Vehicle sales have been moderating after the COVID frenzy. This chart shows that the prices
for used cars have also been correcting. This is very helpful to bring down the goods inflation.
US New Home Sales
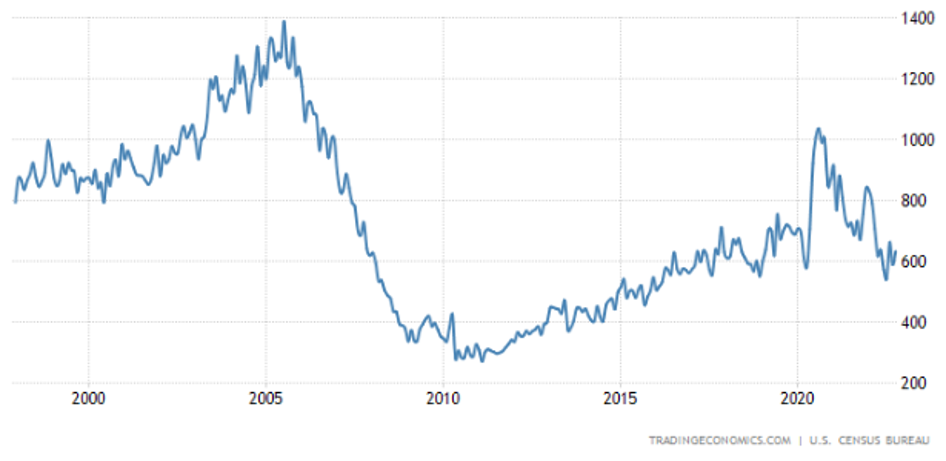
New home sales have followed the rise in mortgage rates and have been slowing considerably. Price corrections
are now seen in many key markets. Home buyers who financed at low rates would be reluctant to make any moves as the rates have
gone up considerably.
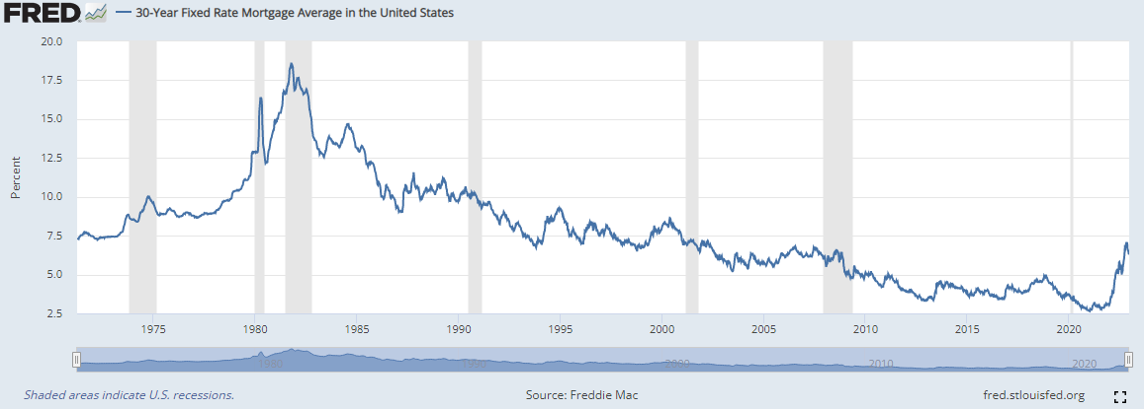
30 Year Fixed Mortgage Rates
New home sales have followed the rise in mortgage rates and have been slowing considerably. Price corrections
are now seen in many key markets. Home buyers who financed at low rates would be reluctant to make any moves as the rates have
gone up considerably.
Employment Indicators
Historical Unemployment Rate
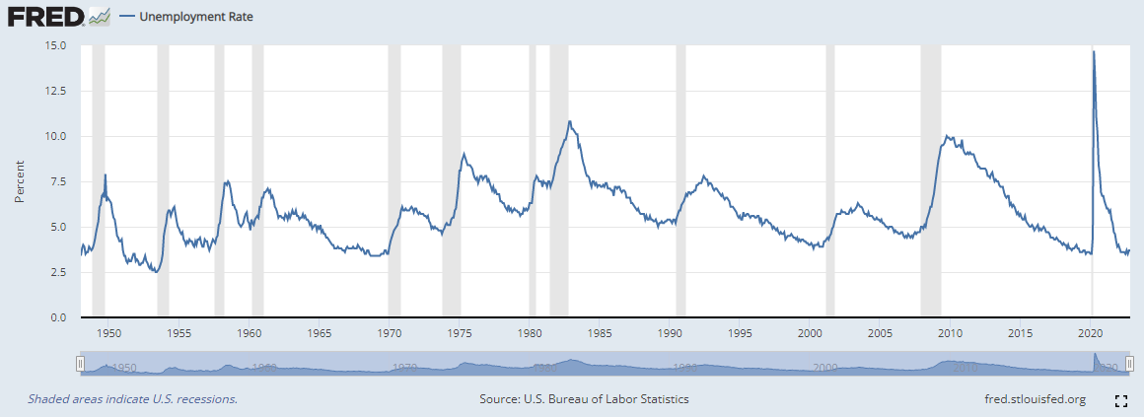
Unemployment rate has remained low despite FED attempt to induce a slowdown. This indicator is a lagging
indicator and we do expect to see this number creep up in the months to come.
Unemployed to Job Openings Ratio
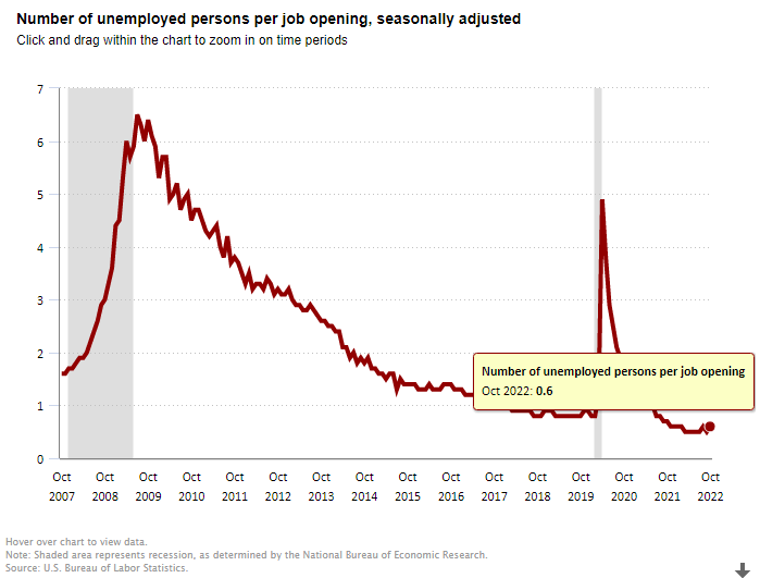
There are about 2 job openings for every unemployed person looking for a job. This is a great situation. Our guess
is that this would change in a hurry in the coming months. We are already seeing layoffs in Tech. This will be coincidental
with cutting open positions. However, we believe the retail sector which is more cyclical is seeing the resurgence due
to reopening after COVID lockdowns. This is likely to keep the job opening number from falling too fast.
US Jobless Claims
Indeed Job Postings
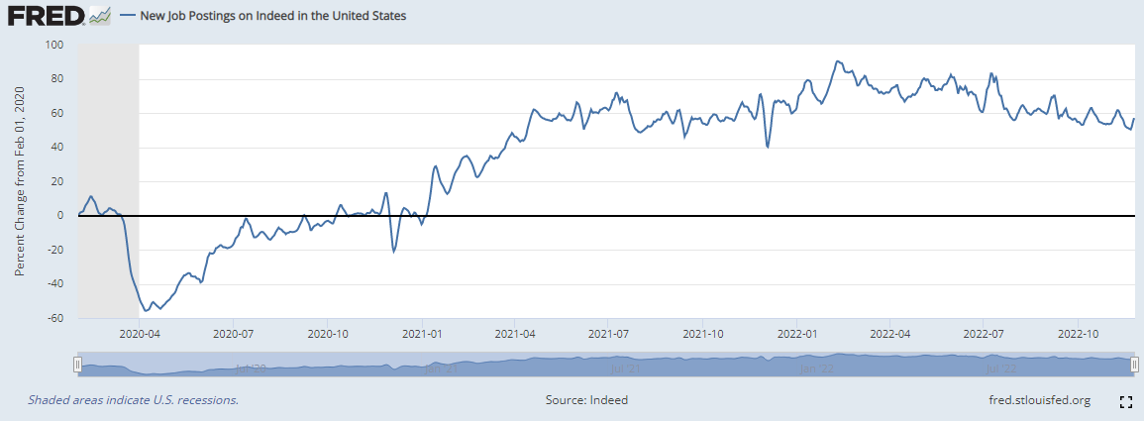
Interestingly, the rate of change in job postings is reducing but the total jobs are still rising according to
this indicator. While this is consistent with the BLS report on job openings to unemployed, we expect to see
some sharp corrections if a recession is imminent.
Wage Growth Tracker
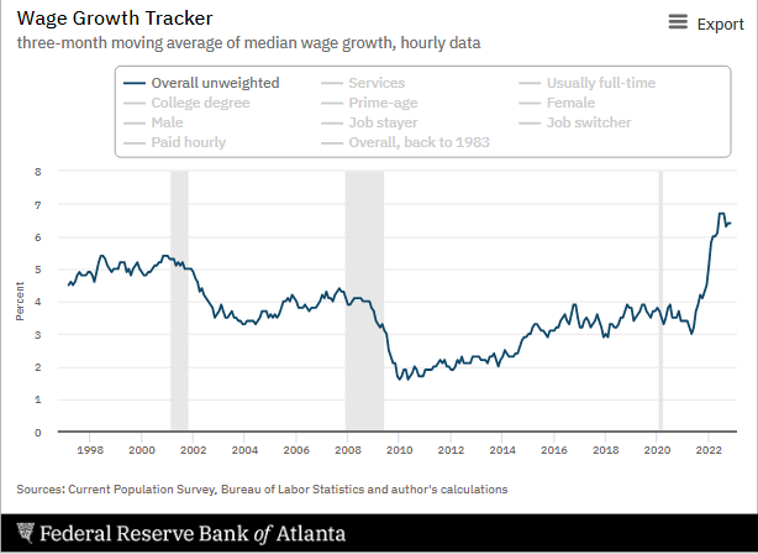
While wage inflation has followed inflation in goods and services, we are glad to see that the inflation has not
become endemic in the job market. The wage inflation rate still trails the overall headline inflation rate.
Market Indicators
Yield Curve Inversion
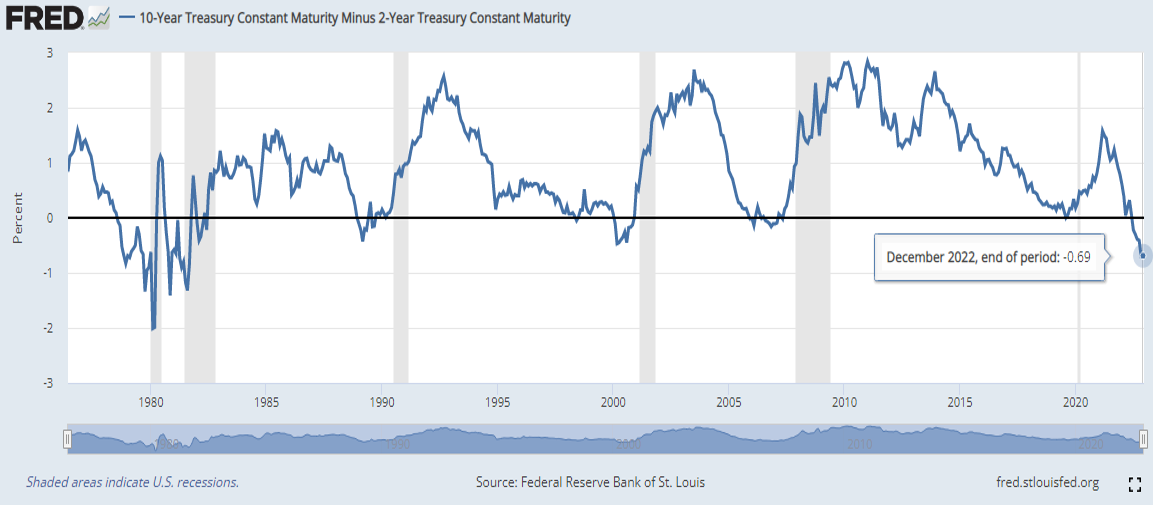
The yield curve remains inverted. The inversion is one of the largest in the last 40 years. This follows
the FED agression to combat the 40 year high inflation rates. From a forward looking perspective, yield
curve inversion is one of the strongest indicator for future recession.
Yield Curve - then and now
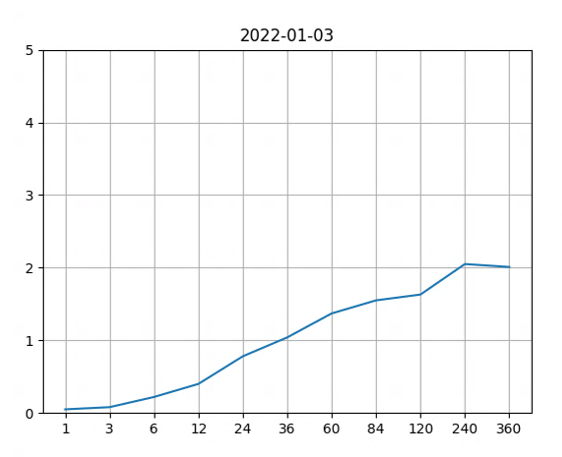 Yield curve - Then
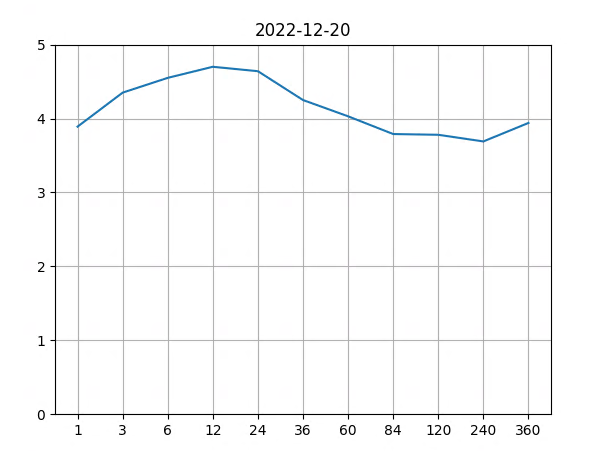 Yield curve - Now
Equity Markets
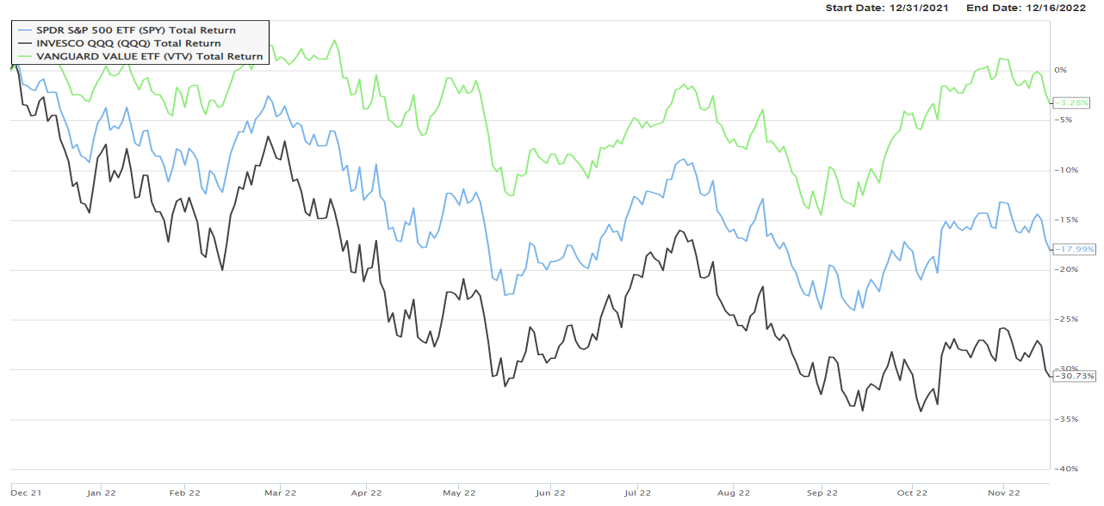
Equity markets have continued their correction this year. The July lows are now surpassed by the September
lows. Most of us are hoping to see some Santa rally in December as most of the FED hawkishness is already been
priced into the markets.
Market Sectors
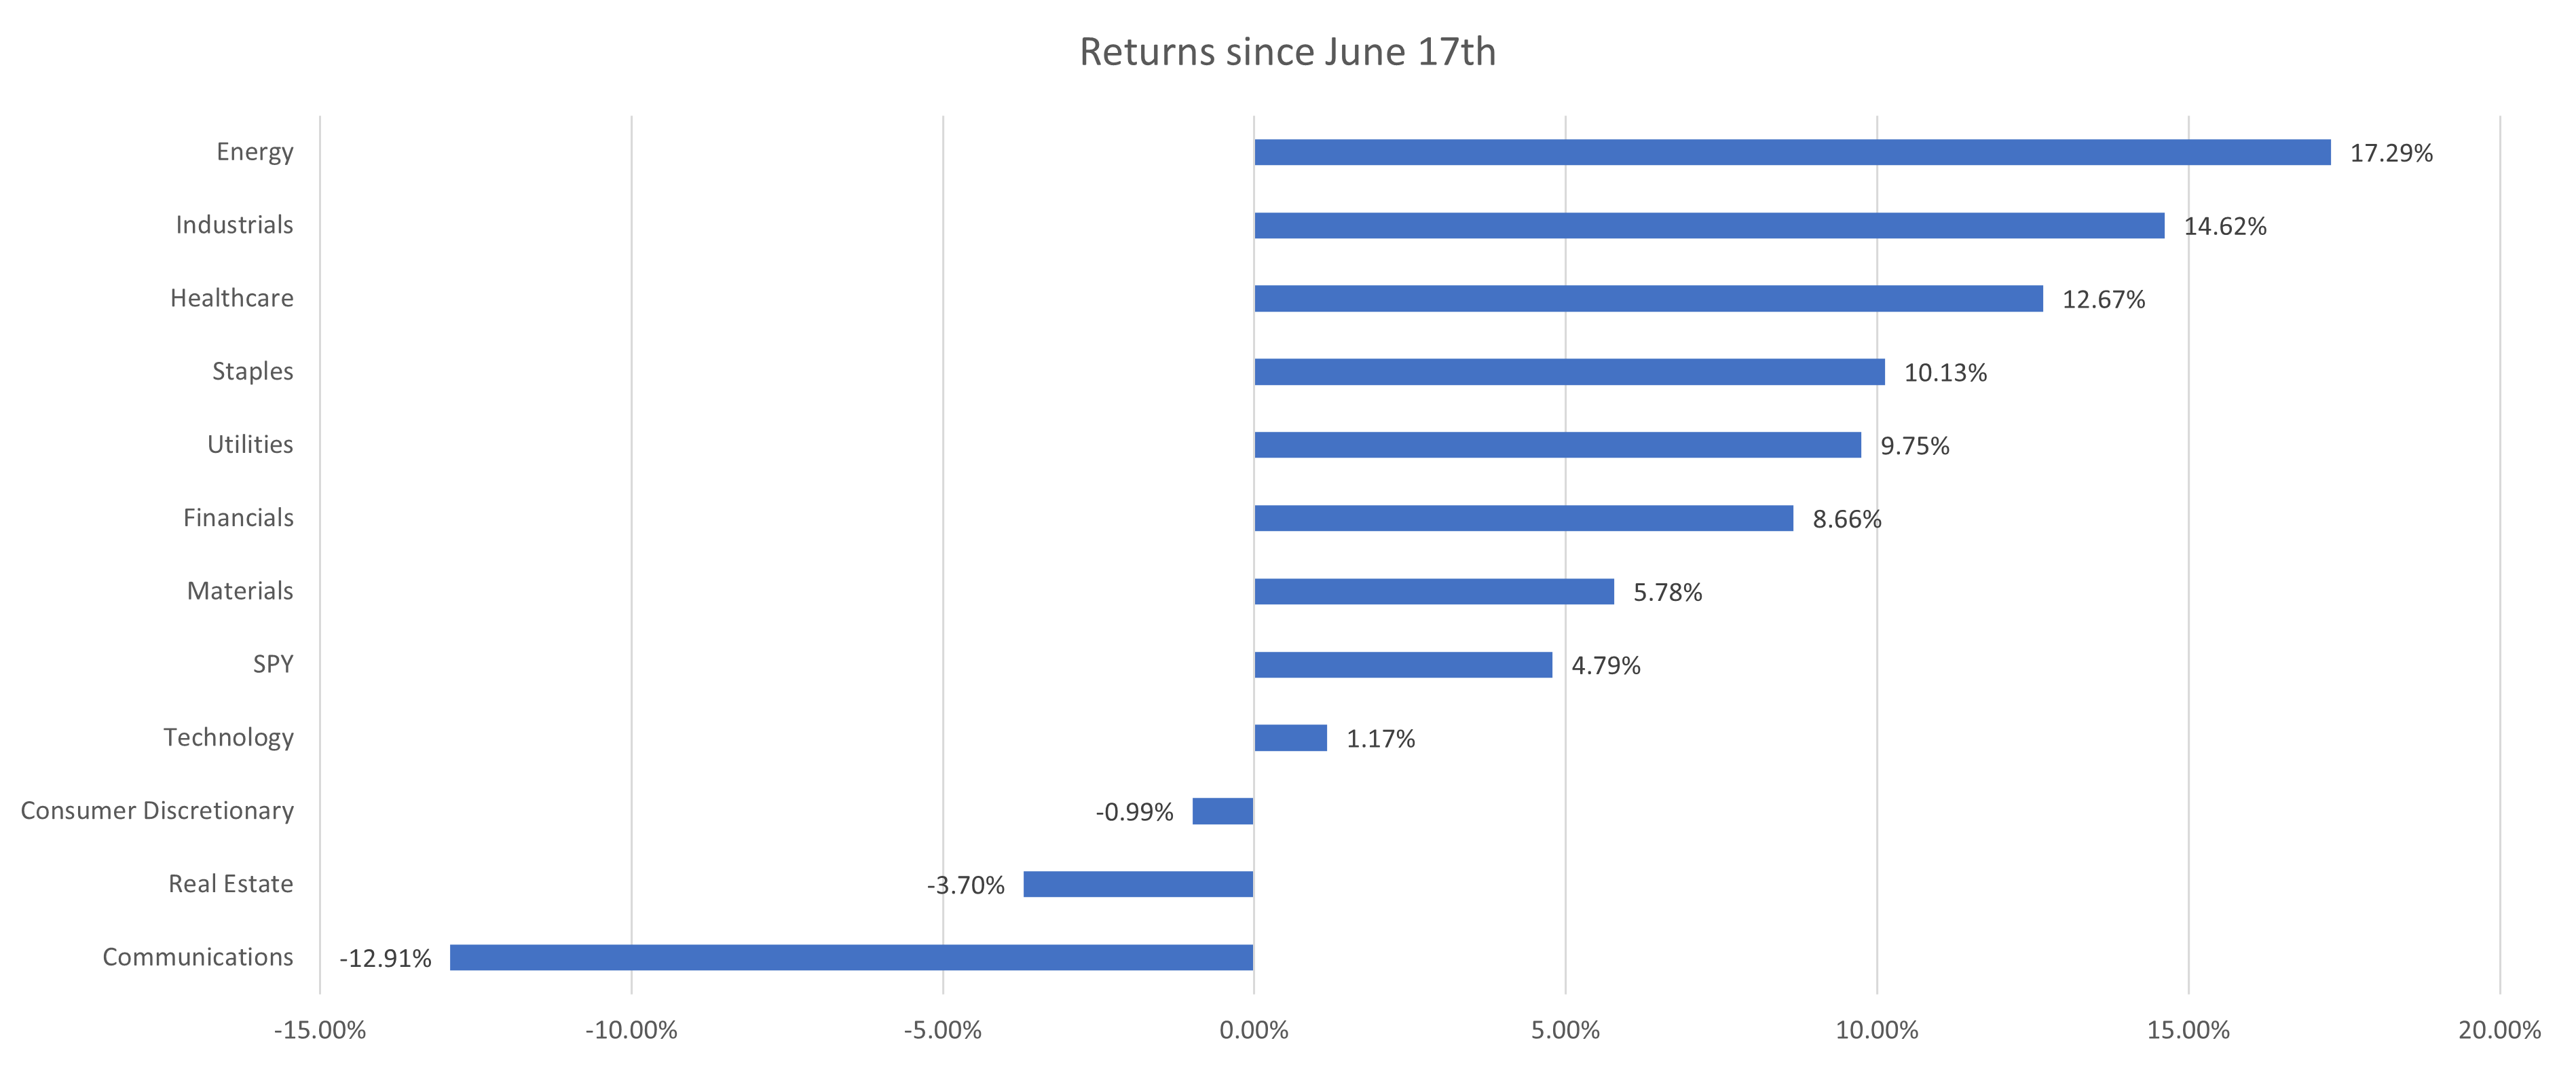
Energy sector has been the top performer while the Communications sector has been the worst for this year. It
is likely to end the year without much change.
High Yield Index Options-Adjusted Spread
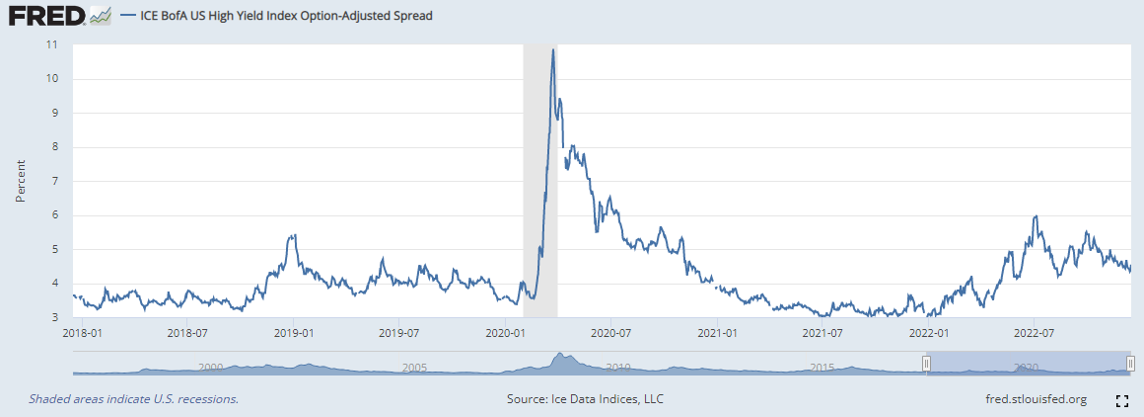
If the economy were to enter a recession, it is likely that some of the companies struggle to keep up with
their debt payment causing their credit spread to widen. This indicator shows how the credit spreads have been
behaving so far. The credit spreads have been pretty muted so far suggesting a healthy credit market.
Put Call Ratio
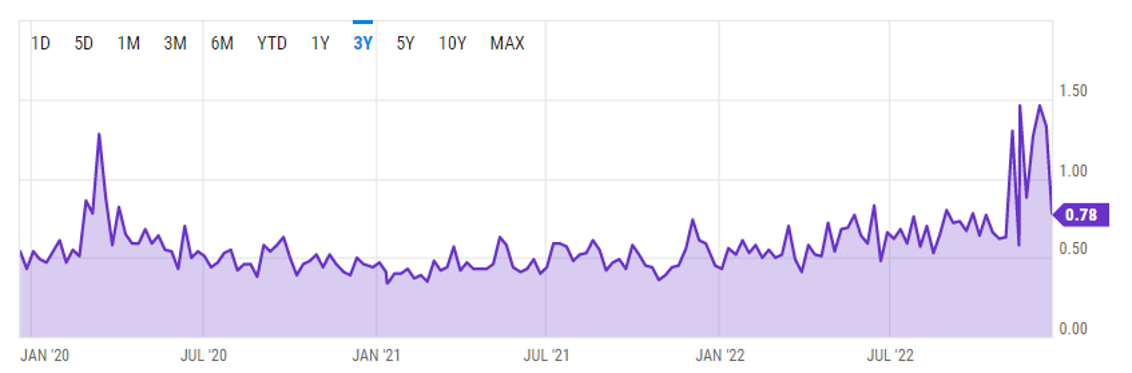
A spike in put / call ratio indicates that investors are very apprehensive of a sudden fall in the equity
markets. The recent activity in this chart suggests this. The spikes happened around the days when FED announced their
rate hikes as well as around the days when the CPI report came. All these suggest that investors are very edgy.
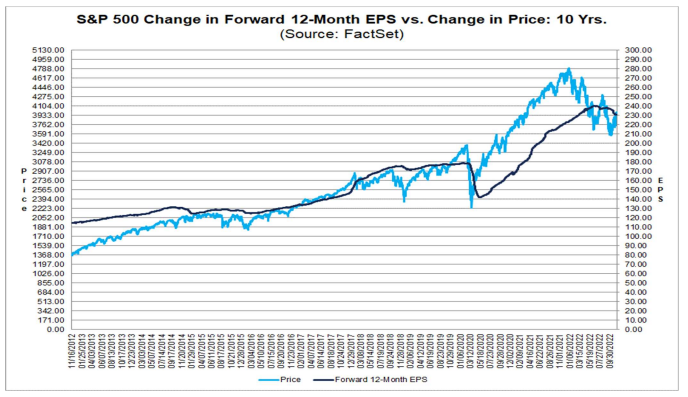
S&P 500 Current Valuations
The current earnings forecast by equity analysts estimate the earnings potential for S&P 500 companies to be
around $230 which translates to a price to earnings ratio of 16.8 at the current S&P 500 price level. This
is very much inline with the 10 year average.
It is likely that as inflation comes down, so will the earnings numbers. This indicates that the future S&P 500 price level could likely come down. Had the price to earnings number been a lower number such as something between 10 to 12, investors could remain optimistic about the S&P 500 price level into 2023.
It is likely that as inflation comes down, so will the earnings numbers. This indicates that the future S&P 500 price level could likely come down. Had the price to earnings number been a lower number such as something between 10 to 12, investors could remain optimistic about the S&P 500 price level into 2023.
Diclosures
- Trillium Square Advisors LLC is a registered investment adviser offering advisory services in the state of North Carolina and in other jurisdictions where exempted. Registration as an investment adviser does not imply a certain level of skill or training, and the content of this communication has not been approved or verified by the United States Security and Exchange Commission or by any state securities authority.
- Information presented is for educational purposes only and does not intend to make an offer or solicitation for the sale or purchase of any specific securities, investments or investment strategies. Market data, articles and other content in this presentation are based on generally available information and are believed to be reliable. Trillium Square does not guarantee the accuracy of the information contained in this presentation. The information is of a general nature and should not be construed as investment advice and relied upon in making investment decisions.
- Investments involve risk and are never guaranteed. Be sure to first consult with a qualified financial adviser before implementing any strategies discussed herein.
- Past performance is not indicative of future performance.
- The content of this communication and any accompanying documents are confidential. They are not to be copied, excerpted or distributed without express written permission of the firm. Any other use beyond its author’s intent, distribution or copying of the contents of this presentation is strictly prohibited. Nothing in this document is intended to be legal, accounting, or tax advise, and is for informational purposes only.
- Hypothetical performance results have many inherent limitations. No representation is being made that any account will or is likely to achieve profits or losses similar to those shown. In fact, there are frequently sharp differences between hypothetical performance results and the actual results subsequently achieved by any particular investment strategy. Hypothetical performance for illustration purposes only.
- Trillium Square will provide all prospective clients with a copy of our current Form ADV, Part 2A (Disclosure Brochure) upon request. At anytime you can view our current Form ADV, Part 2A at https://adviserinfo.sec.gov
© Copyright Trillium Square Advisors LLC. All rights reserved.
Main Address:
Trillium Square Advisors LLC,
423 Peaslake Ct, Rolesville NC - 27571
Office Address:
Trillium Square Advisors LLC,
2840 Plaza Place, Suite 210, Raleigh, NC - 27612