Broad Indicators
Real GDP Growth

GDP: +2.1% Annualized (Quarter 1, 2026)
Real GDP — Annualized Quarter-over-Quarter Change: +2.1% — Advance / Second / Final estimate · Source: Bureau of Economic Analysis
GDP growth of +2.1% in Q1 2026 reflects the current momentum of the US economy.
- Period: March 2026
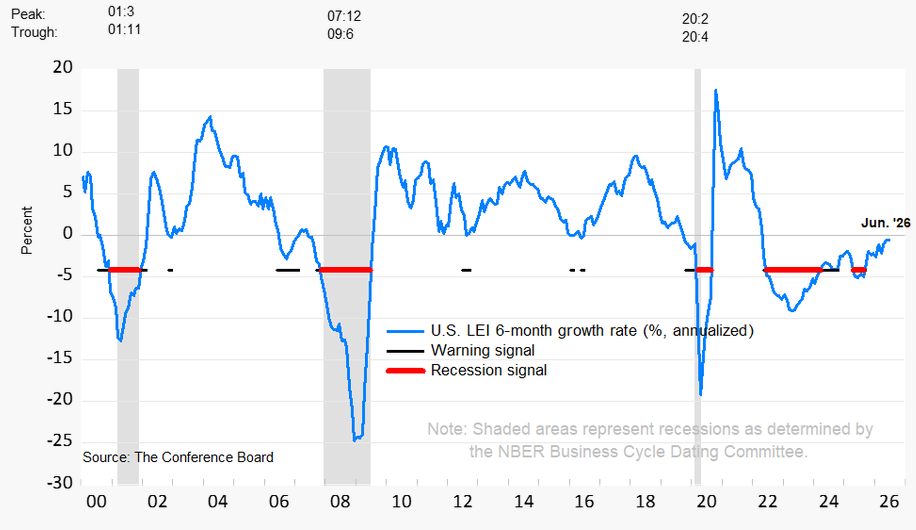
Leading Economic Index (LEI)
LEI 6 month growth rate: -0.3%
Conference Board LEI — June 2026: 99.1 — Month-over-Month Change: -0.2%
The LEI at 99.1 (-0.2% MoM) signals the near-term economic direction. Sustained declines warn of slowdown risk.
- MoM Change: -0.2%
- Data Period: June 2026
US Dollar Index (DXY / Trade-Weighted)
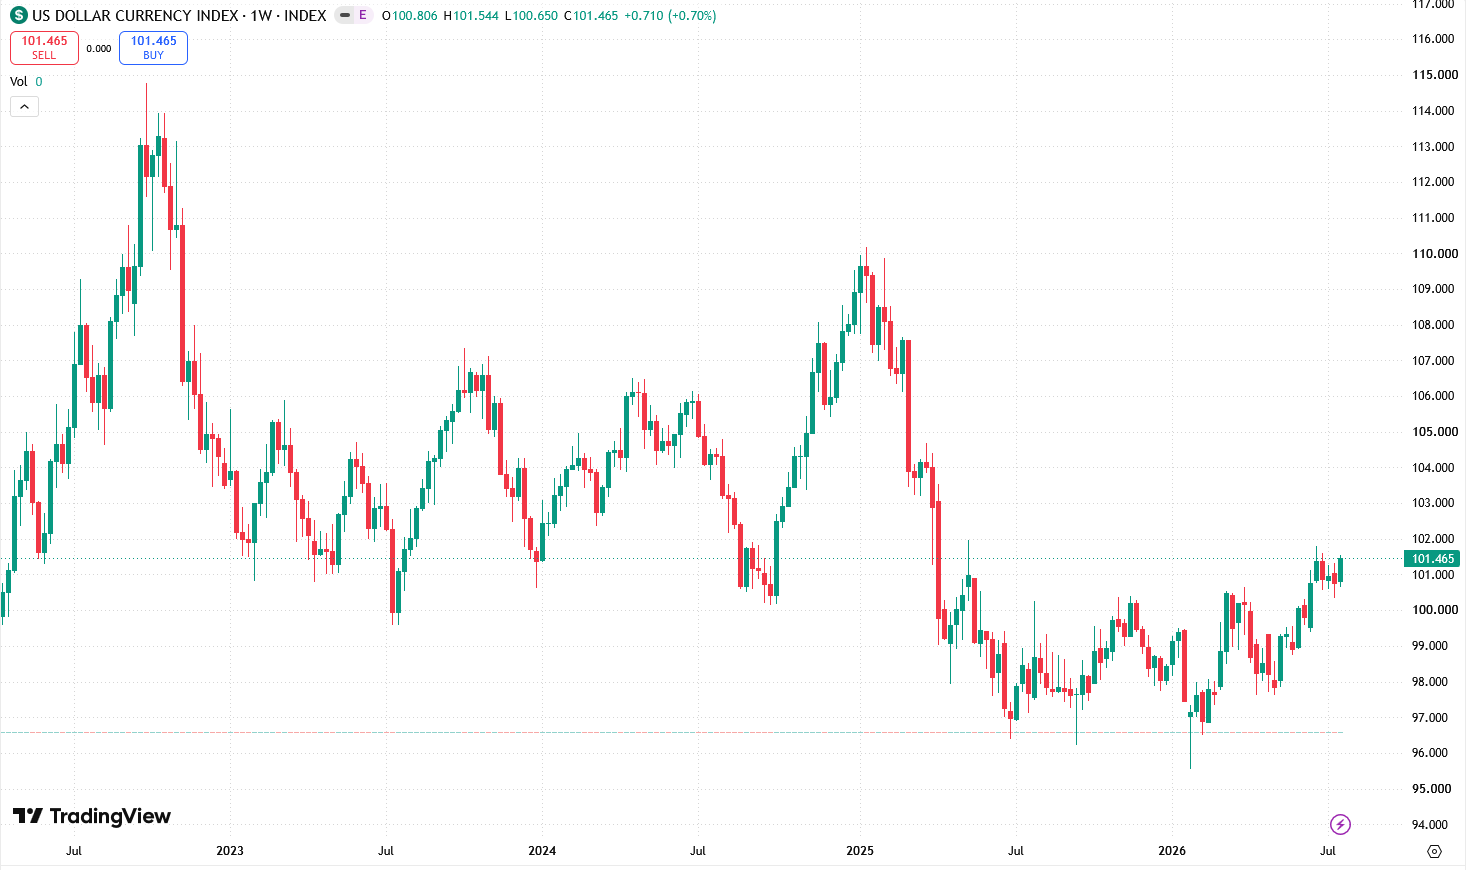
DXY: 101.465 · MoM -0.13% · YoY +4.12%
Broad Trade-Weighted US Dollar Index — 2026-07-26: 101.465 — YoY: -0.13% · MoM: +4.12%
The US dollar at 101.465 reflects global demand for dollar assets and influences import prices, commodity markets, and US exports.
- MoM: -0.13%
- YoY: +4.12%
- Date: 2026-07-26
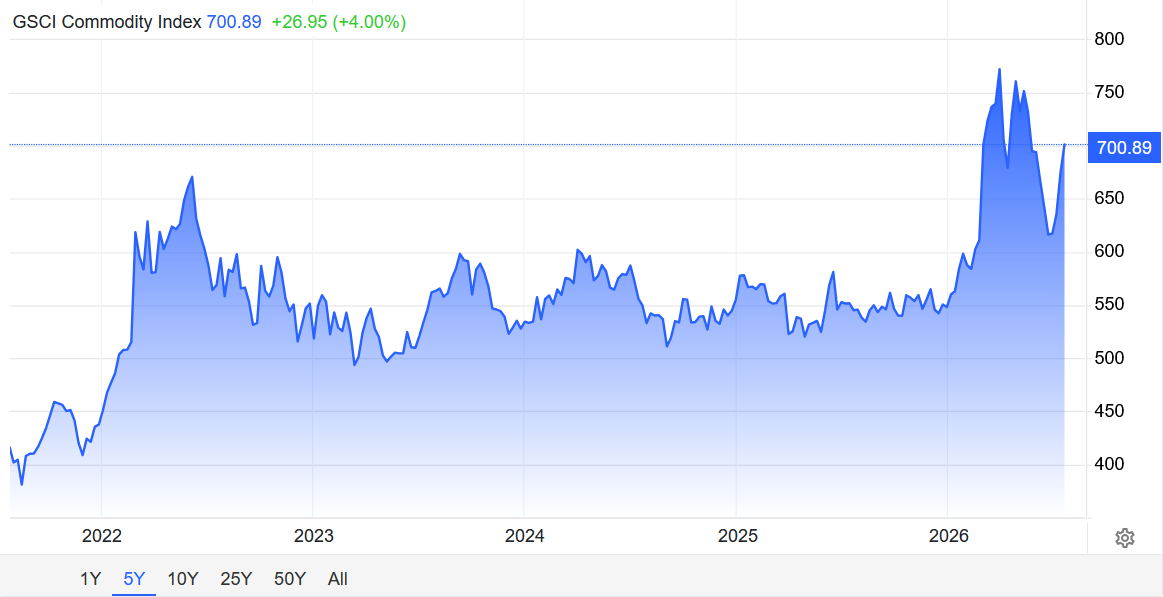
S&P GSCI Commodity Index
GSCI: 700.89 · As of 2026-07-26
S&P GSCI Total Return Index: 700.89 — Broad commodity basket — energy, metals, agriculture
Commodity prices as proxied by the GSCI reflect global demand conditions and supply pressures. Rising GSCI feeds into PPI and eventually CPI.
- Date: 2026-07-26
Gold Price
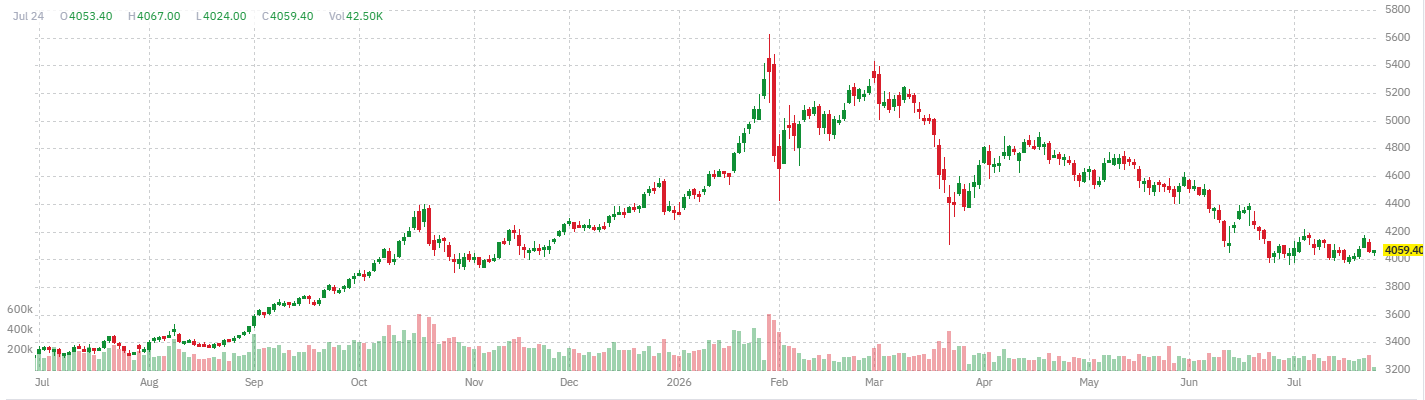
Gold: $4,071 · MoM +2.02% · YoY +31.44%
Gold Spot (USD/oz) — 2026-07-24: $4,071 — London AM Fixing · YoY: +31.44% · MoM: +2.02%
Gold at $4,071 reflects safe-haven demand, real interest rate expectations, and dollar strength. Strong YoY gains signal elevated uncertainty.
- MoM: +2.02%
- YoY: +31.44%
Bitcoin
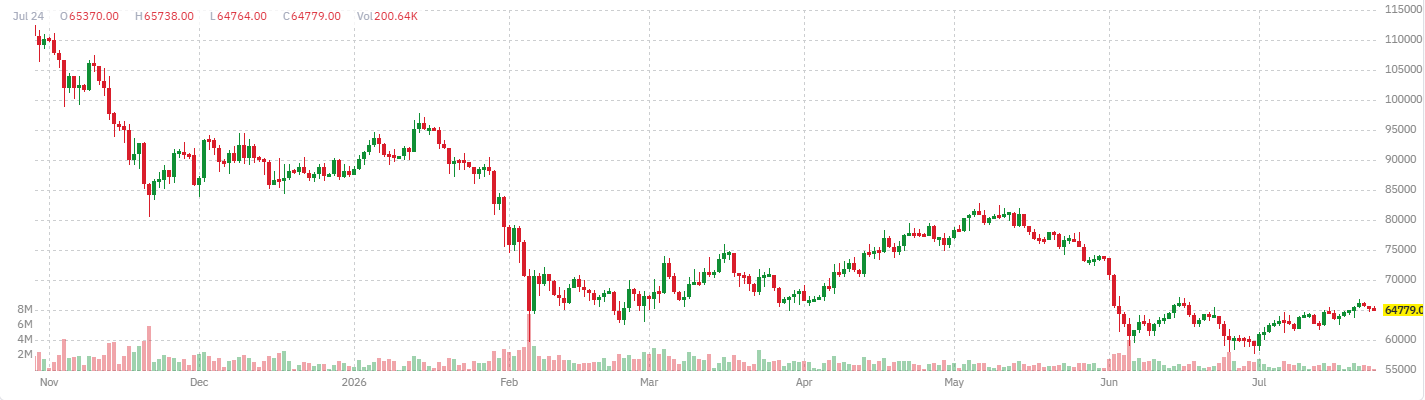
Bitcoin: $64,662 · 7D +0.17% · 30D +8.58%
Bitcoin Price (USD) — 2026-07-26: $64,662 — 7-Day: +0.17% · 30-Day: +8.58%
Bitcoin at $64,662 serves as a risk sentiment indicator. Its performance relative to gold signals the market's risk appetite.
- 7-Day Change: +0.17%
- 30-Day Change: +8.58%
Inflation
CPI Inflation
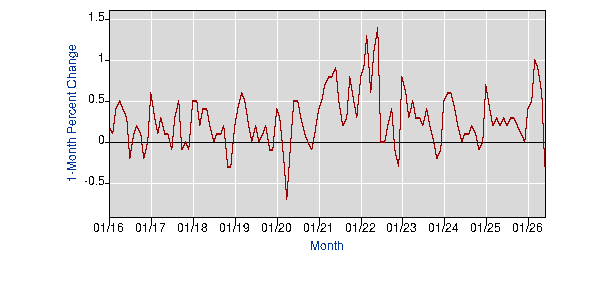
CPI: 2.6% YoY · -0.42% MoM — June 2026
CPI All Items — June 2026: 2.6% — Year-over-Year · MoM: 0.0%
CPI at 2.6% YoY in June 2026. The Fed's 2% target remains well below the current inflation rate.
- YoY: 2.6%
- MoM: 0.0%
- Period: June 2026
PPI Inflation (Producer Prices)
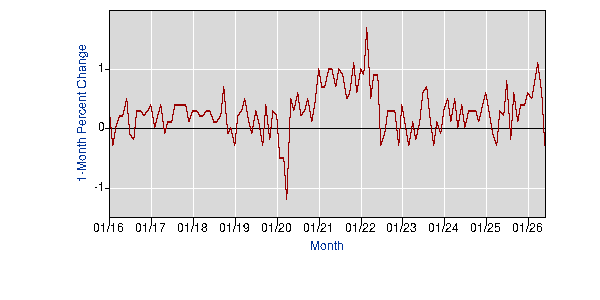
PPI Final Demand: 5.5% YoY · -0.3% MoM — June 2026
PPI Final Goods — June 2026: 5.5% — Year-over-Year · MoM: -0.3%
PPI at 5.5% YoY is a leading indicator of consumer inflation. Rising producer prices typically pass through to CPI within 1–3 months.
- YoY: 5.5%
- MoM: -0.3%
1-Year Inflation Expectations (UMich)
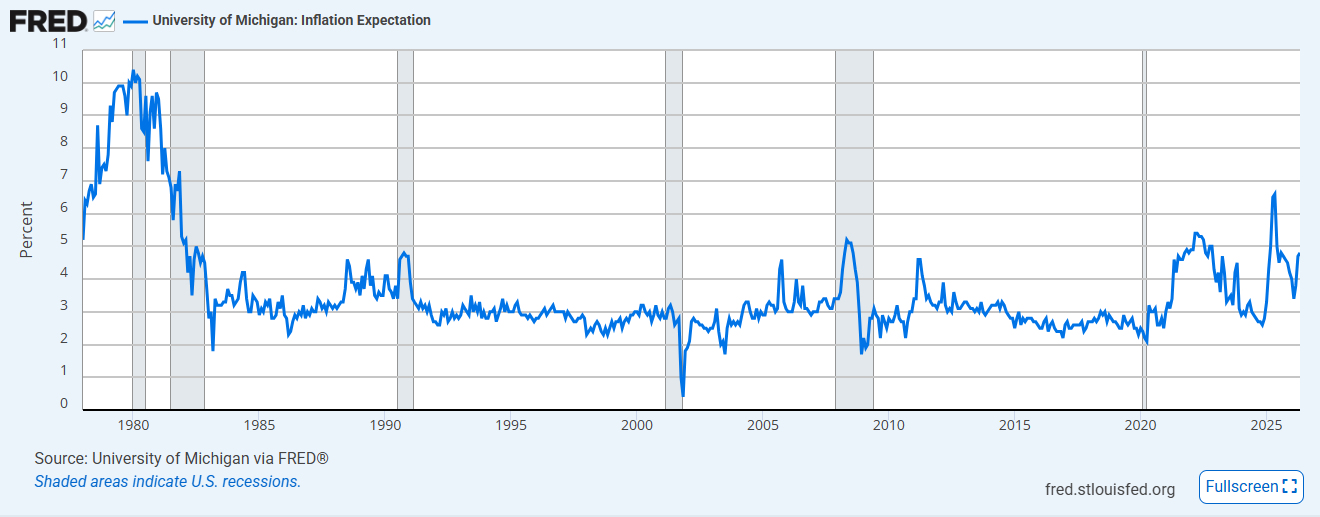
1-Year Inflation Expectations: 4.8% · MoM +0.1%
1-Year Inflation Expectations — May 2026: 4.8% — Consumer survey · MoM: +0.1%
Inflation expectations at 4.8% matter enormously — the Fed monitors this closely. De-anchoring above 4% historically forces more aggressive policy response.
- MoM: +0.1%
- Period: May 2026
Sentiments
Consumer Sentiment (UMich)
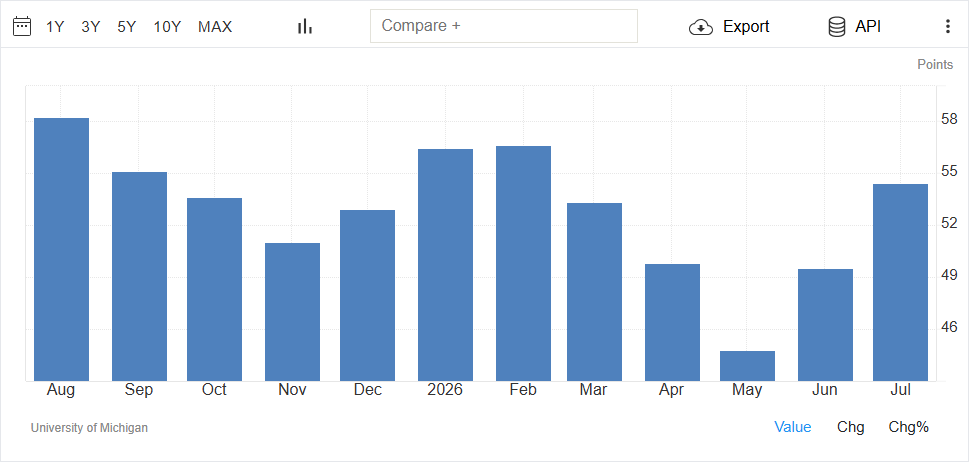
Consumer Sentiment: 54.4 · MoM +4.9 pts — July 2026
UMich Consumer Sentiment — July 2026: 54.4 — MoM Change: +4.9 pts
Consumer sentiment at 54.4 reflects household outlook on finances and the economy. Readings below 70 historically precede spending pullbacks.
- MoM Change: +4.9 pts
- Period: July 2026
Investor Sentiment (AAII)
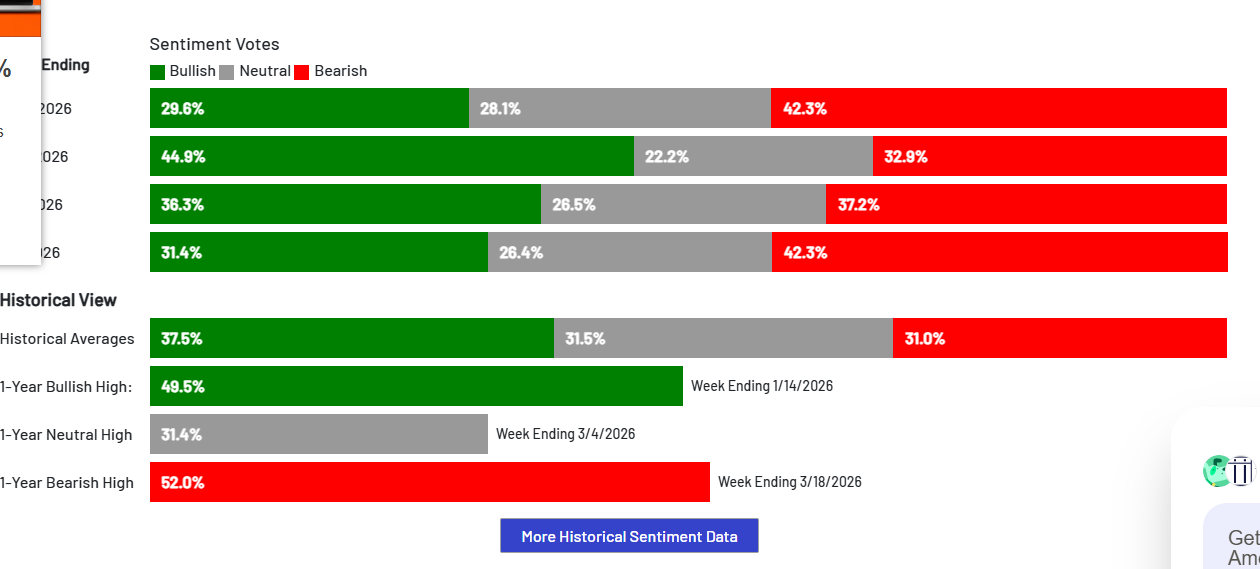
Bullish: 29.6% · Bearish: 42.3% · Neutral: 28.1%
AAII Sentiment Survey — Week of 2026-07-26: 42.3% Bearish — Bullish: 29.6% · Neutral: 28.1%
AAII sentiment is a contrarian indicator. Extreme bearishness (>50%) historically marks near-term market bottoms; extreme bullishness (>55%) warns of complacency.
- Bullish: 29.6%
- Bearish: 42.3%
- Neutral: 28.1%
GDP Factors
ISM Manufacturing PMI
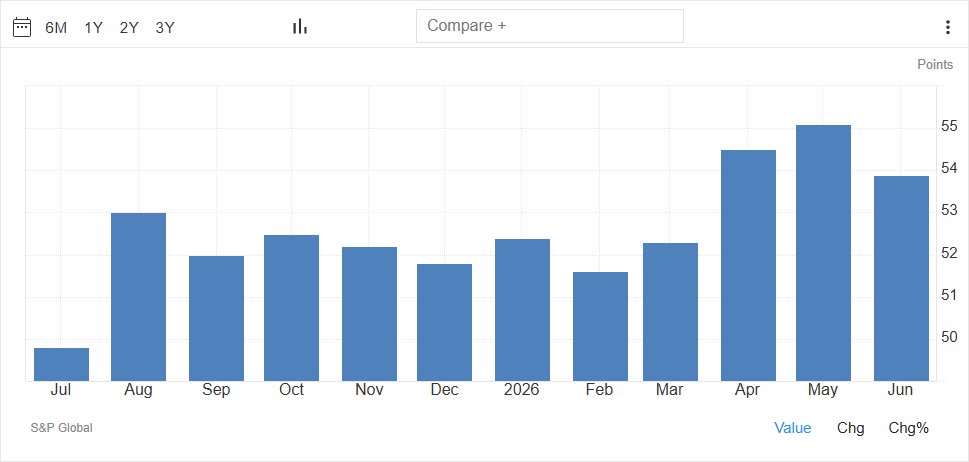
ISM Mfg PMI: 53.3 — Expanding (50 = threshold)
ISM Manufacturing PMI — 2026-07-26: 53.3 — Above 50 = expansion · Below 50 = contraction
Manufacturing PMI of 53.3 indicates the factory sector is in expansion. Manufacturing has outsized influence on employment and capital expenditure cycles.
- Signal: Expanding
- Threshold: 50.0
ISM Services PMI
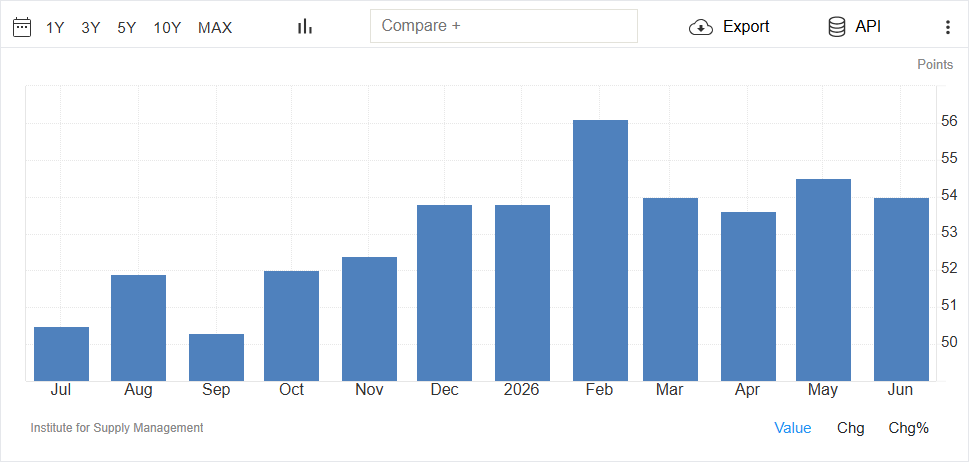
ISM Services PMI: 54.0 — Expanding
ISM Services PMI — 2026-07-26: 54.0 — Services represent ~80% of US GDP
Services PMI at 54.0 covers the dominant segment of the US economy. Sustained readings below 50 signal broad economic contraction.
- Signal: Expanding
Industrial Production Index
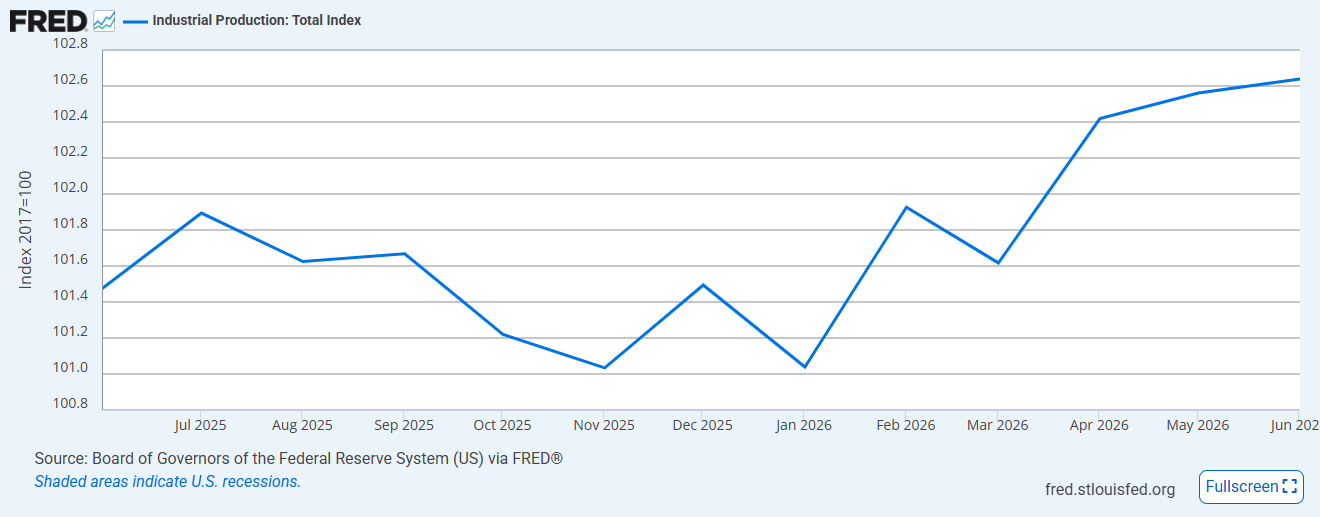
Industrial Production: 102.64 · MoM +0.08% · YoY +1.14%
Industrial Production Index — June 2026: +0.08% — MoM change · Index level: 102.64 · YoY: +1.14%
Industrial production at 102.64 (+0.08% MoM) reflects the health of manufacturing, mining, and utilities. A key real-economy gauge alongside ISM surveys.
- MoM: +0.08%
- YoY: +1.14%
Retail Sales
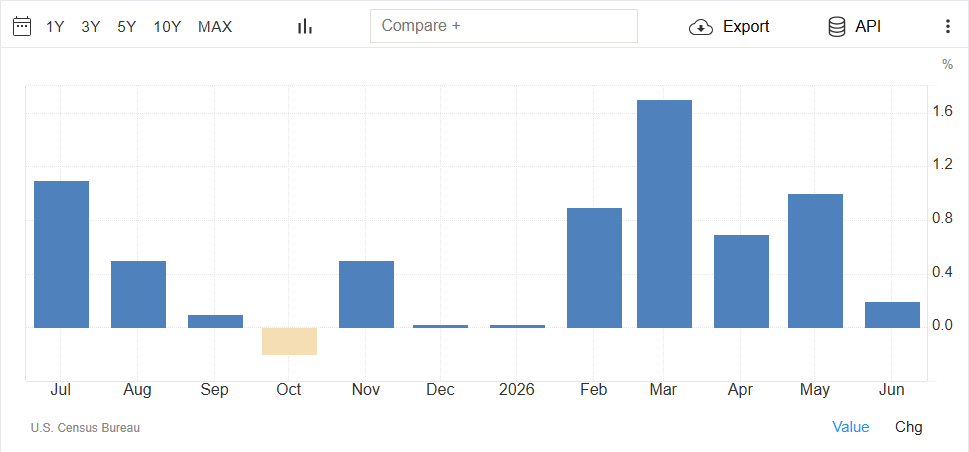
Retail Sales: +0.24% MoM · +7.19% YoY — June 2026
Retail & Food Service Sales — June 2026: +0.24% — Month-over-Month · YoY: +7.19%
Retail sales +0.24% MoM in June 2026 reflect the consumer's willingness to spend. Consumer spending drives ~70% of US GDP — retail trends are the economy's pulse.
- MoM: +0.24%
- YoY: +7.19%
Non-Farm Payrolls
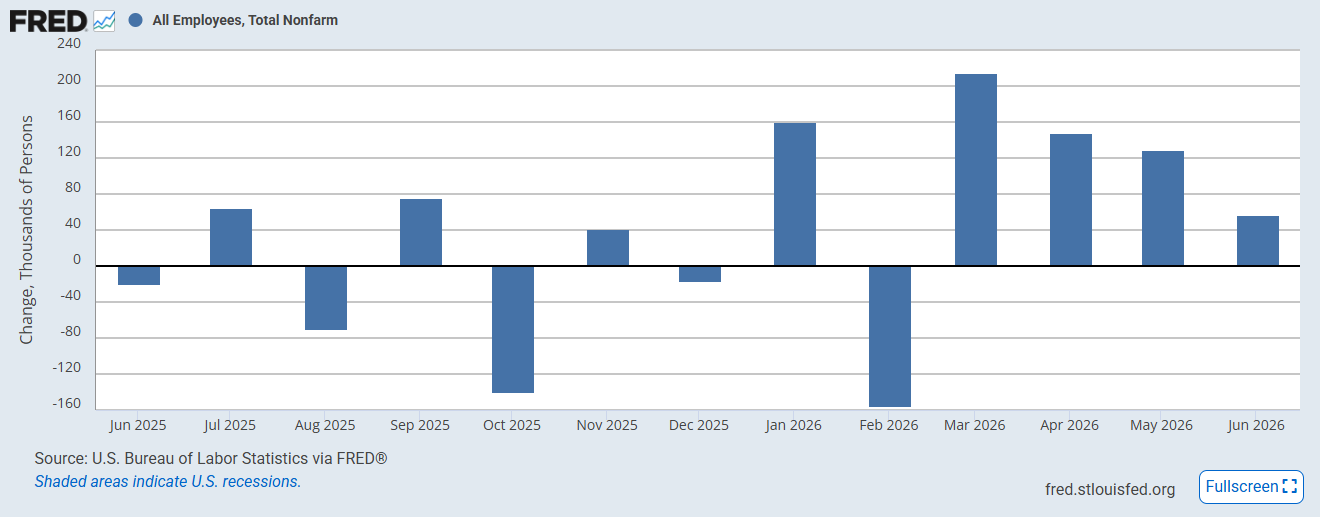
NFP: +57k Jobs Added — June 2026
Non-Farm Payrolls Change — June 2026: +57k — Prior Month: +129k
Payrolls of +57k in June 2026. Sustained prints below 100k/month signal labor market deterioration; above 200k signals robust demand for workers.
- This Month: +57k
- Prior Month: +129k
Total Vehicle Sales
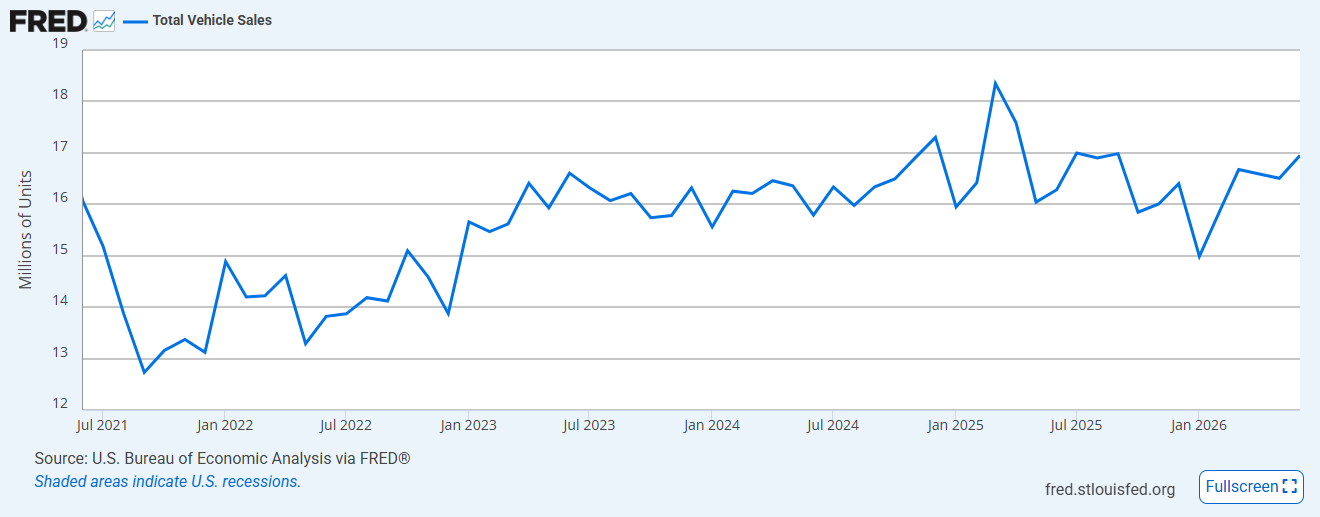
Vehicle Sales: 16.95M SAAR — June 2026
Total Light Vehicle Sales SAAR — June 2026: 16.95M SAAR — MoM change: +0.44M million units
Vehicle sales at 16.95M SAAR are a discretionary spending bellwether. Pre-pandemic average was ~17M SAAR — levels significantly below that indicate consumer caution.
- SAAR Level: 16.95M SAAR
- MoM Change: +0.44M
Manheim Used Vehicle Value Index
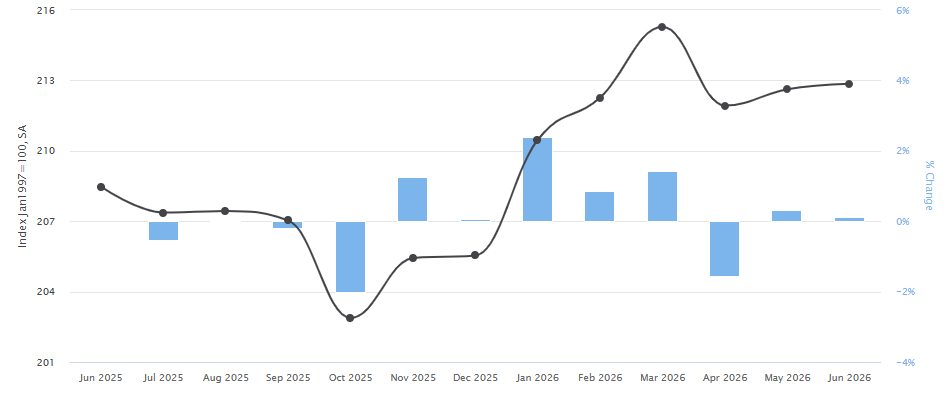
Manheim Index: 212.90 · MoM +0.10%
Manheim Used Vehicle Value Index — 2026-07-26: 212.90 — MoM: +0.10% (seasonally adjusted)
The Manheim index at 212.90 is a leading indicator for used-car CPI. Rising used car prices add directly to core CPI with a 1–2 month lag.
- MoM: +0.10%
New Home Sales Monthly Supply
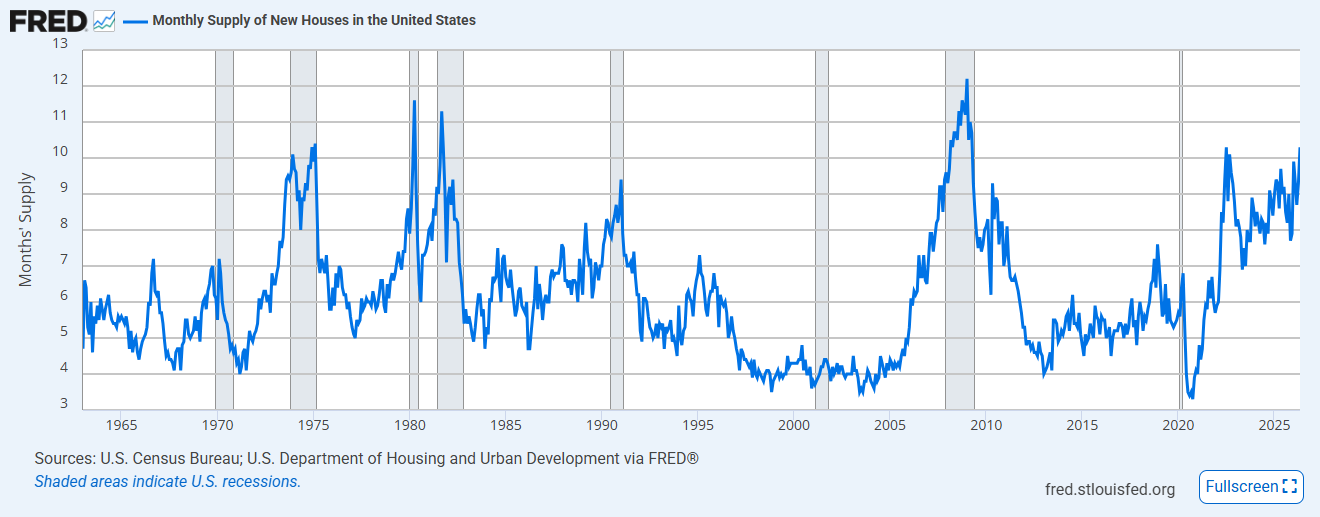
New Home Supply: 9.3 months — June 2026 (5–6 months = balanced)
Monthly Supply of New Houses — June 2026: 9.3 months — Months of supply at current sales pace · Balanced = 5–6 months
New home supply at 9.3 months signals a buyer's market with excess inventory. Sustained oversupply puts downward pressure on new home prices.
- Period: June 2026
- Balanced Level: 5–6 months
30-Year Fixed Mortgage Rate
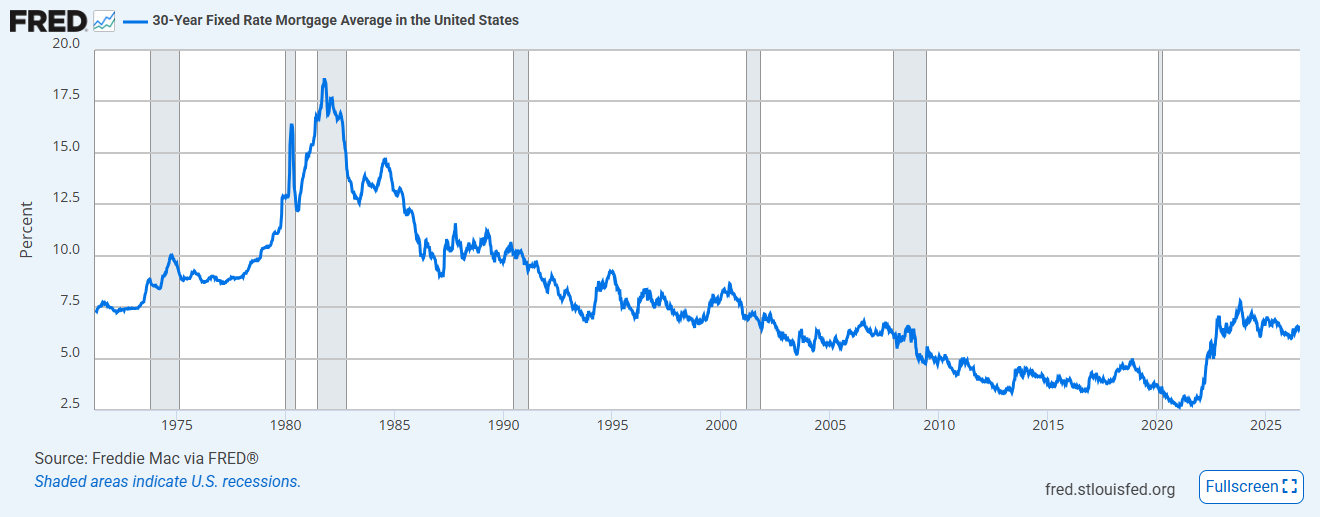
30-Year Rate: 6.58% · WoW +0.03% — 2026-07-23
30-Year Fixed Mortgage Rate — Week of 2026-07-23: 6.58% — Freddie Mac Primary Mortgage Market Survey · WoW: +0.03%
Mortgage rates at 6.58% remain at historically restrictive levels. Meaningful housing recovery requires rates well below 6%.
- WoW Change: +0.03%
- Survey Date: 2026-07-23
- Affordable Level: < 5.5%
Employment Indicators
Unemployment Rate
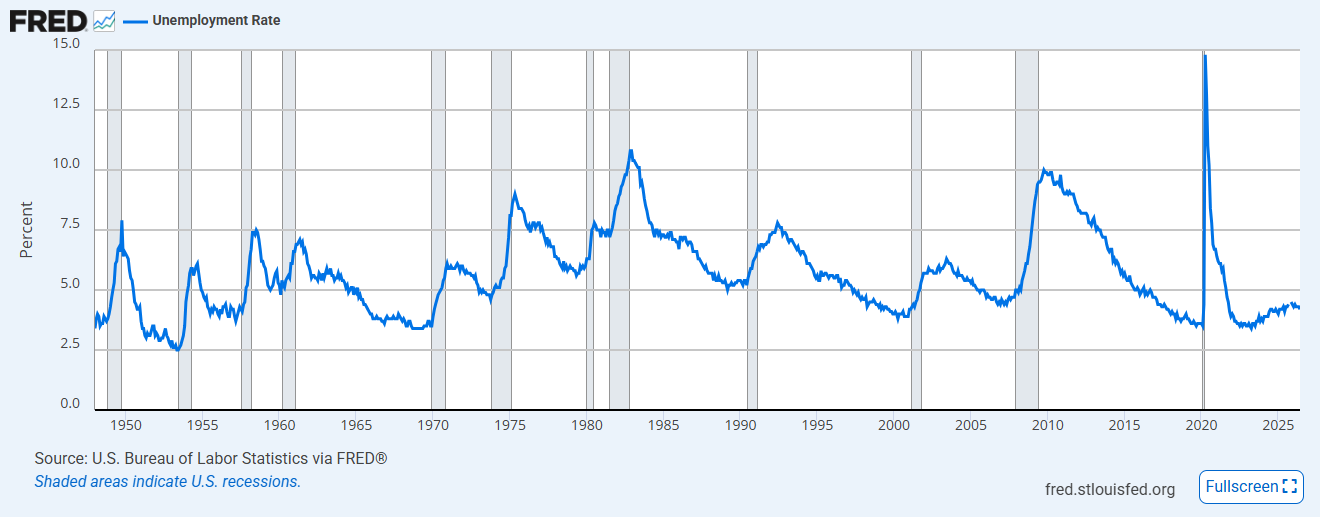
Unemployment: 4.2% · MoM -0.1pp — June 2026
Unemployment Rate — June 2026: 4.2% — Seasonally Adjusted · MoM: -0.1pp
Unemployment at 4.2% is softening gradually. A move above 4.5% would significantly raise recession risk assessments.
- MoM Change: -0.1pp
- Period: June 2026
- Recession Signal: > 4.5%
Jobless Claims
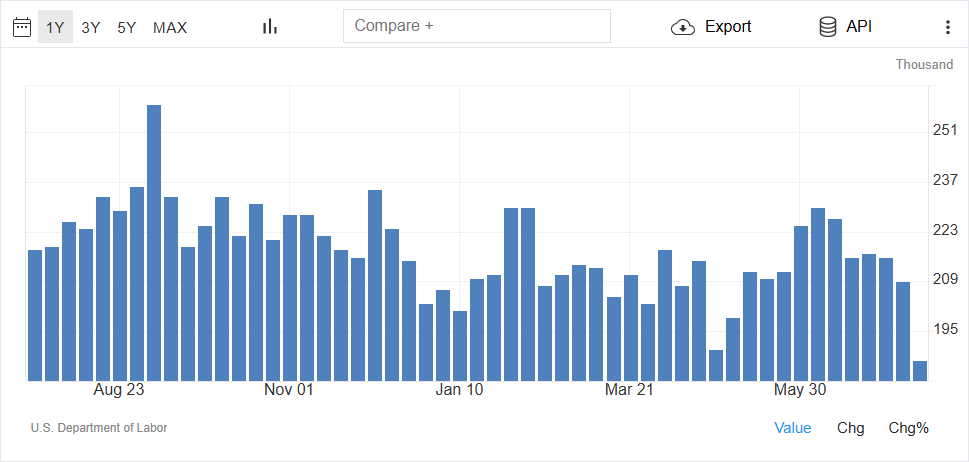
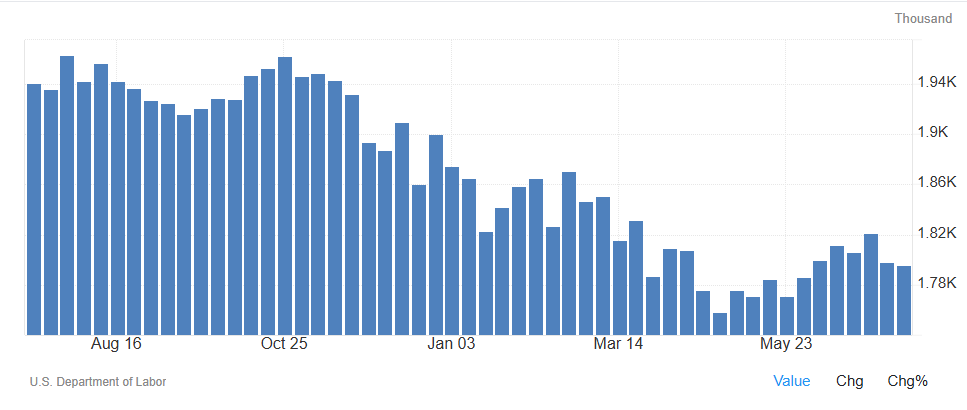
Initial Claims: 187,000K (-22,000K WoW) · Continuing: 1,796,000K
Initial Jobless Claims — Week of 2026-07-18: 187,000K — WoW change: -22,000K · Continuing Claims: 1,796,000K
Initial claims of 187,000K and continuing claims of 1,796,000K. Watch for sustained initial claims above 260k as the threshold for labor market deterioration.
- Initial (wk 2026-07-18): 187,000K
- WoW Change: -22,000K
- Continuing (2026-07-11): 1,796,000K
- Alert Threshold: > 260K
Market Indicators
Yield Curve (10Y–2Y Spread)
10Y–2Y Spread: +0.36% · Un-inverted — Normalizing
10-Year minus 2-Year Treasury Yield — 2026-07-24: +0.36% — MoM change: +0.06pp · Recession signal: sustained inversion
The yield curve has un-inverted to +0.36% — normalizing from prolonged inversion. Watch whether steepening accelerates.
- Spread: +0.36%
- Status: Normal
- MoM Change: +0.06pp
High Yield OAS Spread
HY OAS: 2.77% · MoM +0.01pp
ICE BofA US HY OAS Spread — 2026-07-23: 2.77% — MoM: +0.01pp · Crisis threshold: >8%
HY OAS at 2.77% indicates calm credit markets with tight spreads — risk appetite is healthy. Spreads above 8% historically signal systemic stress.
- OAS Spread: 2.77%
- MoM Change: +0.01pp
- Crisis Level: > 8%
Put/Call Ratio
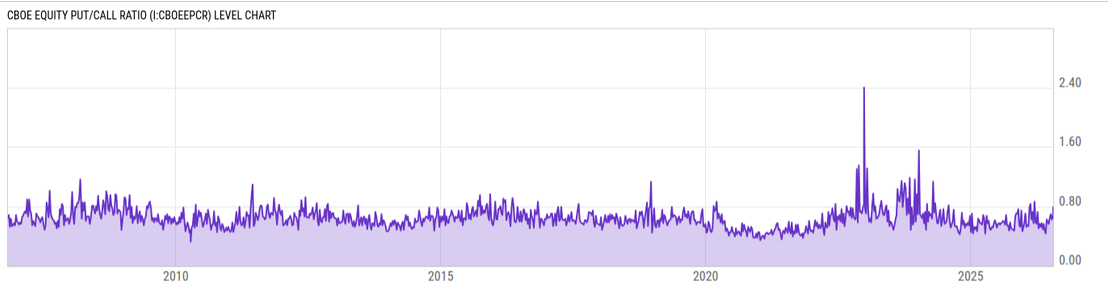
Put/Call Ratio: 0.99 — Fearful / Hedging
CBOE Total Put/Call Ratio — 2026-07-26: 0.99 — Below 0.7 = bullish · Above 1.0 = fear · Contrarian indicator
Put/Call ratio at 0.99. As a contrarian indicator: extreme fear (ratio >1.2) often marks near-term bottoms, while complacency (ratio <0.5) can precede corrections.
- Ratio: 0.99
- Signal: Cautious
S&P 500 Valuation & Earnings
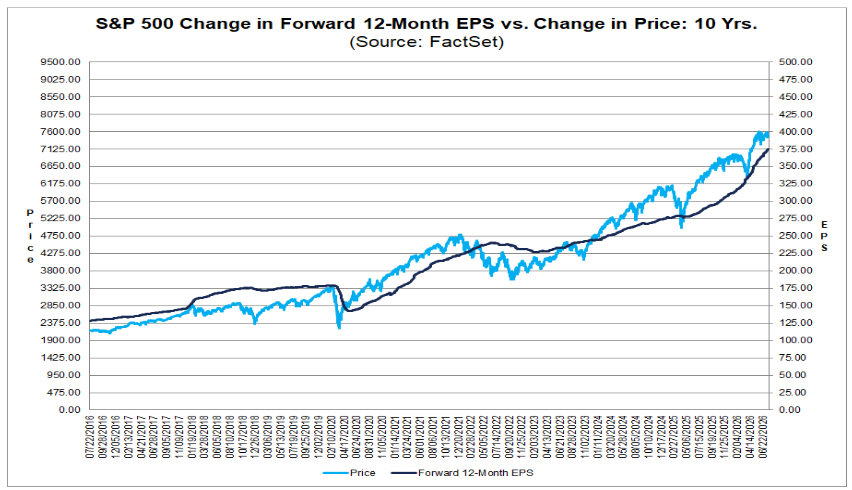
S&P 500 P/E: 20.25x — Stretched Valuation
S&P 500 Price/Earnings Ratio — 2026-07-24: 20.25x — Historical average ~17x · Elevated = >22x
S&P 500 trading at 20.25x. Elevated P/E ratios reduce the margin of safety and make equities more vulnerable to earnings disappointments or rate shocks.
Macro Economic Update — July 2026
- P/E Ratio: 20.25x
- Hist. Avg: ~17x
- Date: 2026-07-26
Diclosures
- Trillium Square Advisors LLC is a registered investment adviser offering advisory services in the state of North Carolina and in other jurisdictions where exempted. Registration as an investment adviser does not imply a certain level of skill or training, and the content of this communication has not been approved or verified by the United States Security and Exchange Commission or by any state securities authority.
- Information presented is for educational purposes only and does not intend to make an offer or solicitation for the sale or purchase of any specific securities, investments or investment strategies. Market data, articles and other content in this presentation are based on generally available information and are believed to be reliable. Trillium Square does not guarantee the accuracy of the information contained in this presentation. The information is of a general nature and should not be construed as investment advice and relied upon in making investment decisions.
- Investments involve risk and are never guaranteed. Be sure to first consult with a qualified financial adviser before implementing any strategies discussed herein.
- Past performance is not indicative of future performance.
- The content of this communication and any accompanying documents are not to be copied, excerpted or distributed without express written permission of the firm. Any other use beyond its author’s intent, distribution or copying of the contents of this presentation is strictly prohibited. Nothing in this document is intended to be legal, accounting, or tax advise, and is for informational purposes only.
- Hypothetical performance results have many inherent limitations. No representation is being made that any account will or is likely to achieve profits or losses similar to those shown. In fact, there are frequently sharp differences between hypothetical performance results and the actual results subsequently achieved by any particular investment strategy. Hypothetical performance for illustration purposes only.
- Trillium Square will provide all prospective clients with a copy of our current Form ADV, Part 2A (Disclosure Brochure) upon request. At anytime you can view our current Form ADV, Part 2A at https://adviserinfo.sec.gov
© Copyright Trillium Square Advisors LLC. All rights reserved.