Economic Updates for June 2024
Summary
Economic Optimism and Tech Sector Momentum Drive Market Rally
The technology generals are still on a tear, melting upwards. Recent earnings reports from NVDA, as well as a softer inflation report, have fueled this rally.
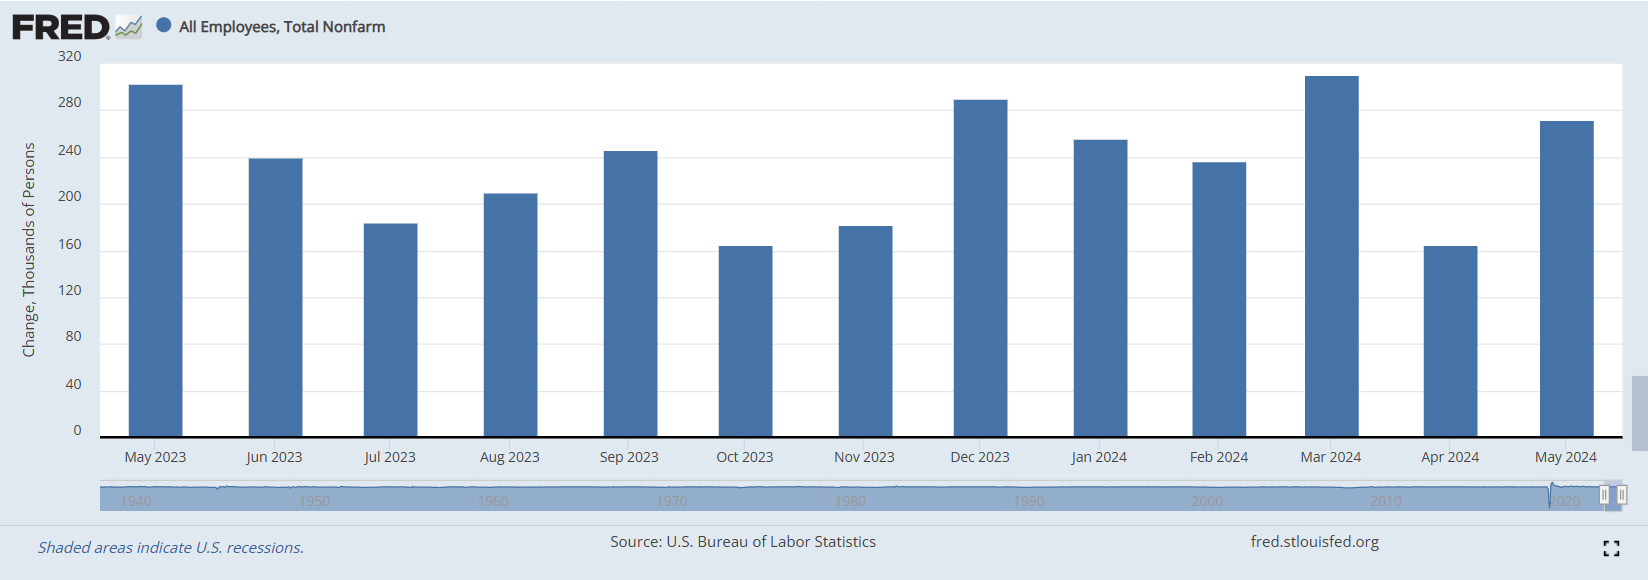
Consumer confidence is picking up after a short dip. Manufacturing and Services PMIs are firmly in positive territory. Payrolls are beating expectations by a wide margin. The economy overall seems to be in a great place.
Typically, summer months exhibit higher volatility; however, this May has been strong, just like the early part of this year. We hope this continues as market strategists turn to question the valuations in large-cap stocks. The gap between large-cap and small-cap stocks has never been so significant. Although valuations are high, they are still sane—companies with higher valuations have positive earnings and are growing at a healthy clip.
Recently, there have been questions around the software sector—can they sustain their coveted margins in the face of excessive capex required to build out AI? It will be interesting to watch as many software companies diverge on this perspective, and the market picks the winners and losers.
Broad Indicators
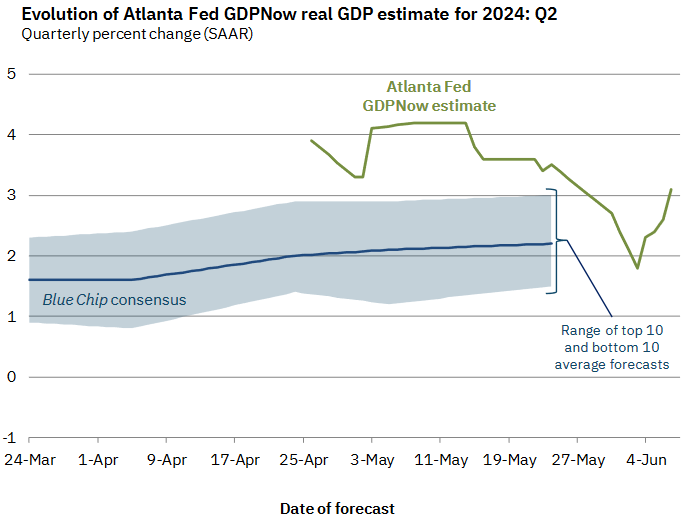
Atlanta GDP NowCast
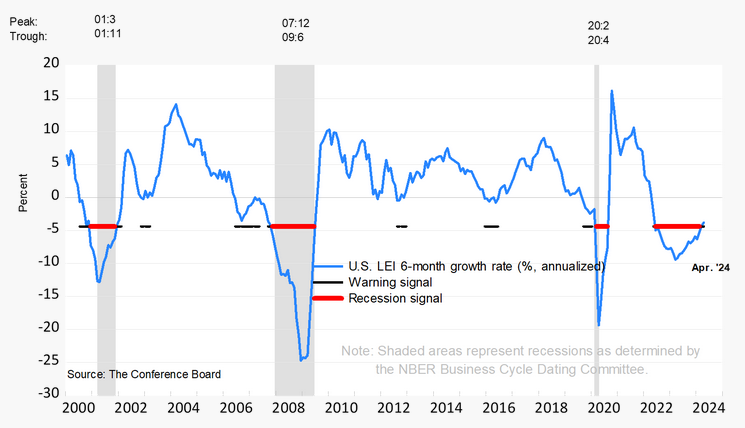
Conference Board's Leading Economic Indicator
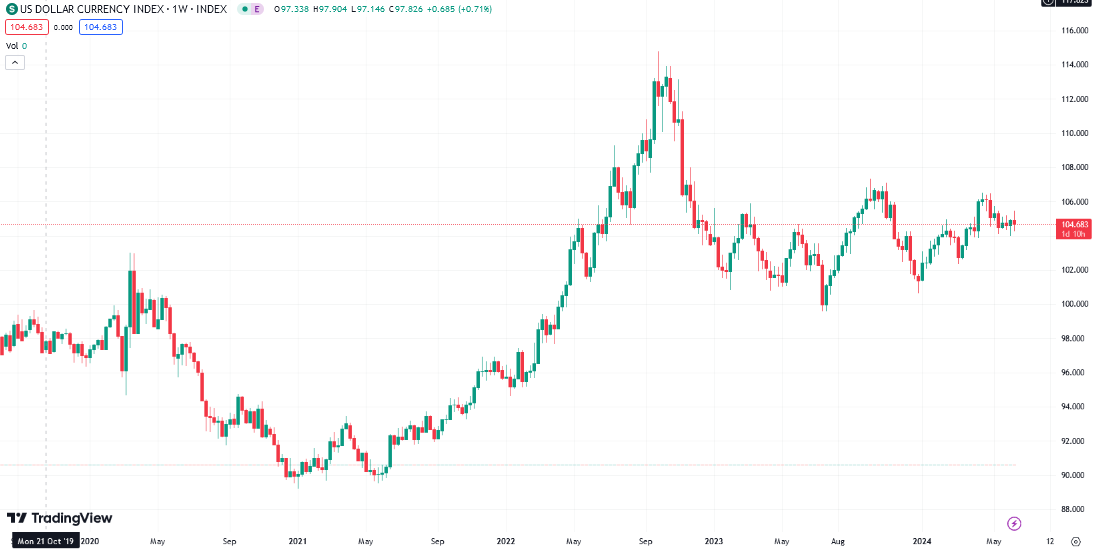
US Dollar Index
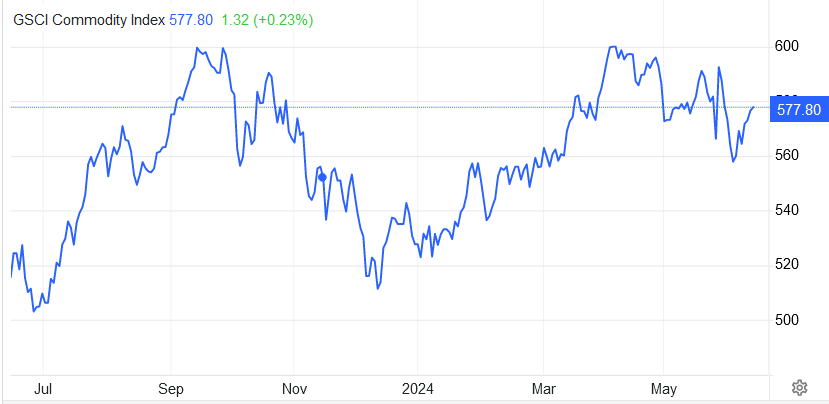
Commodities
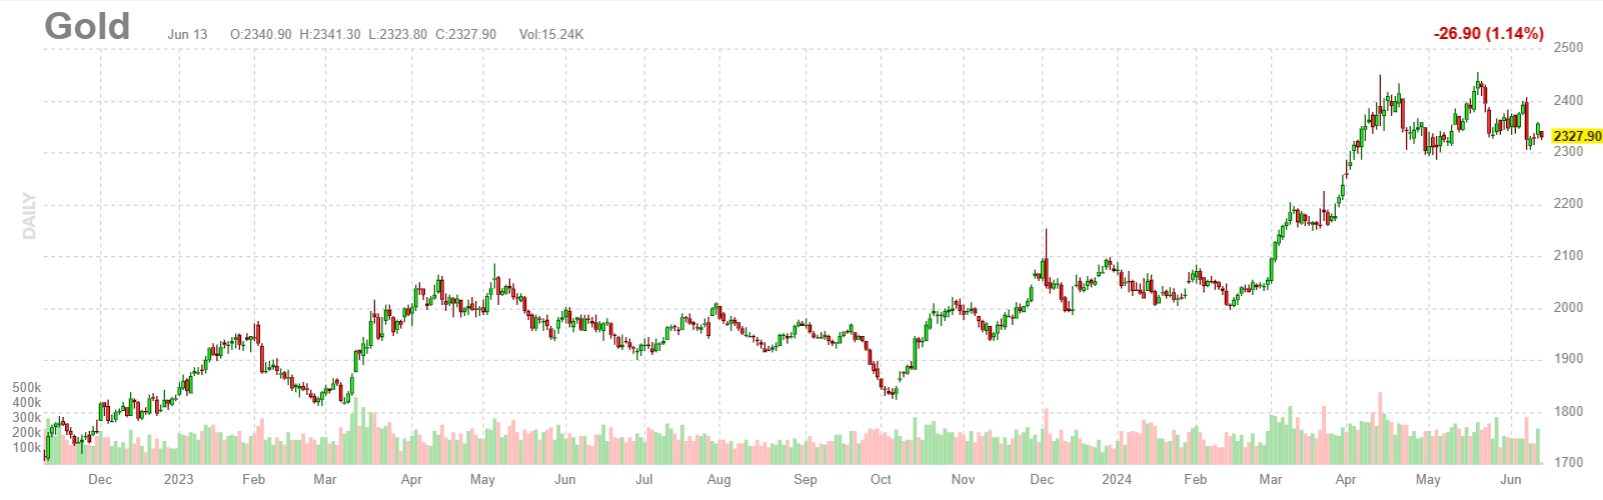
Gold
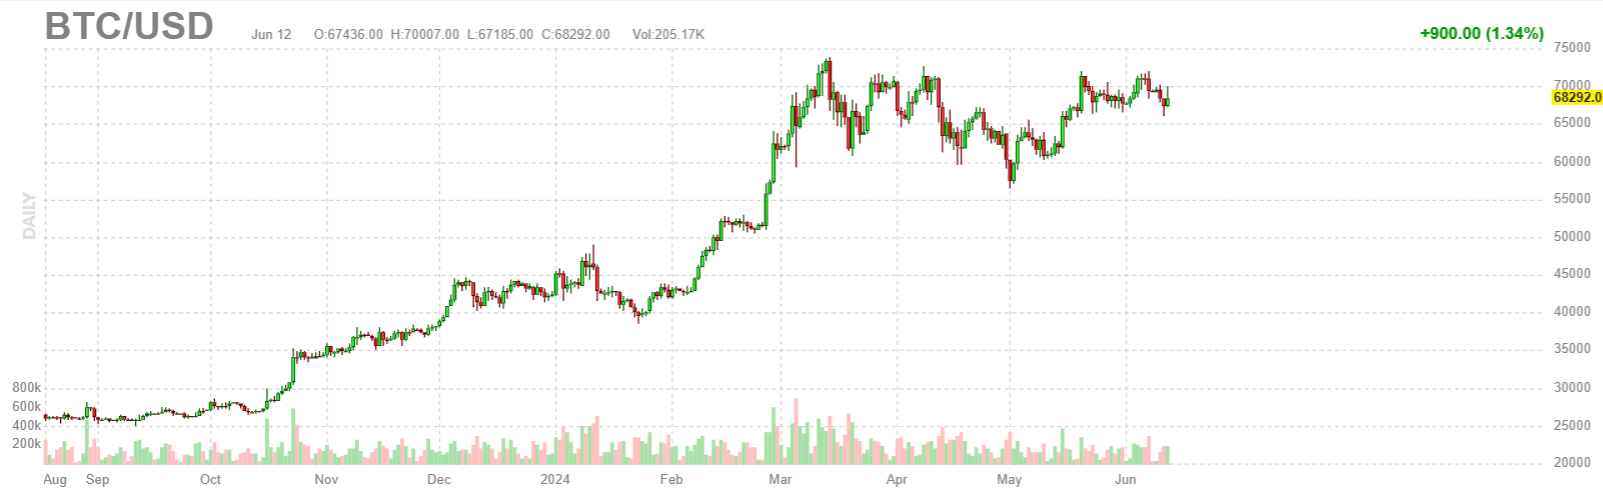
Bitcoin
Inflation
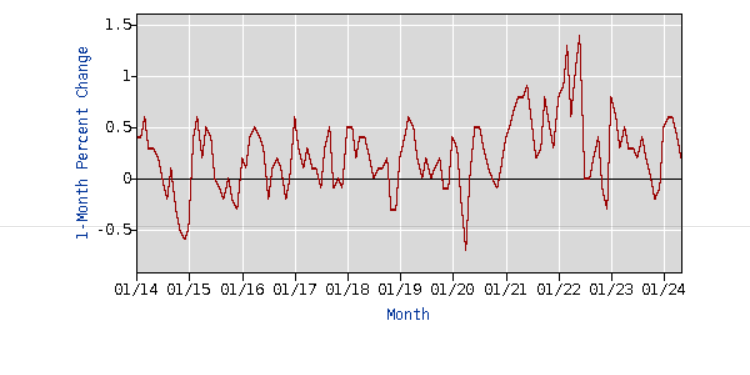
CPI Month over Month
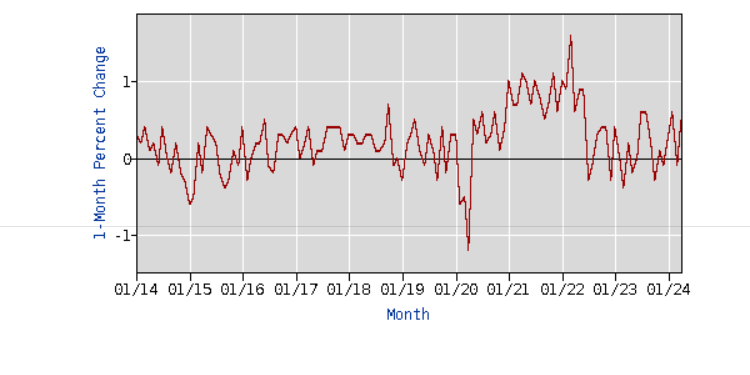
PPI Month over Month
Reported Year over Year Inflation Rate
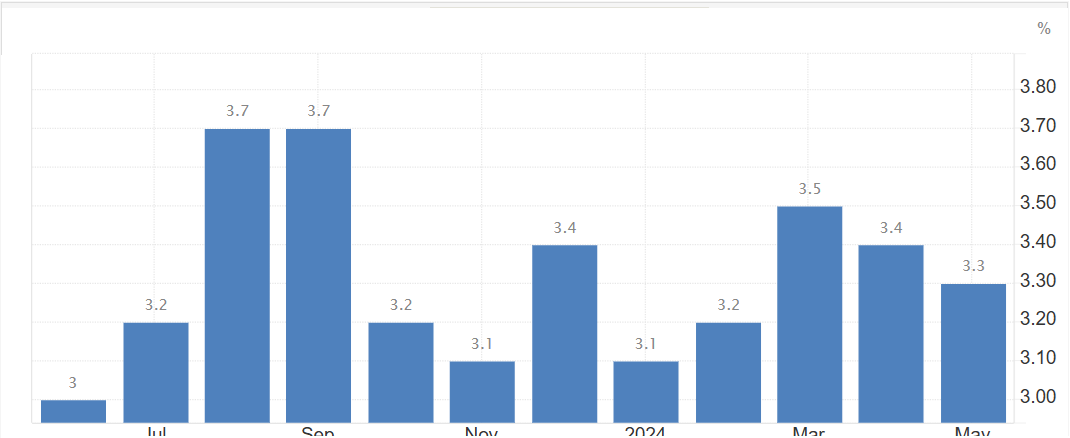
CPI Components
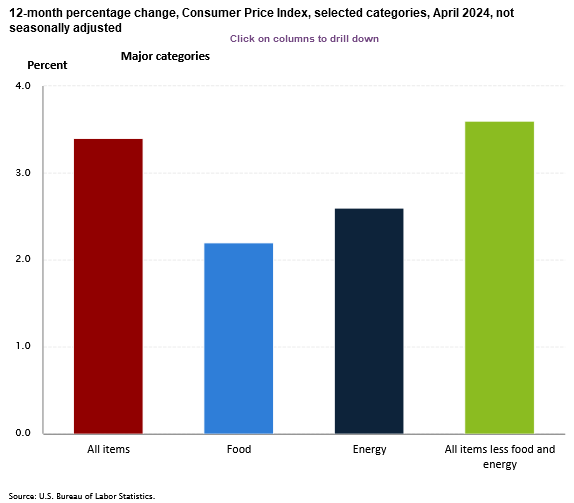 CPI Components Last Month
Source BLS.gov Consumer Price Index
CPI Components Last Month
Source BLS.gov Consumer Price Index
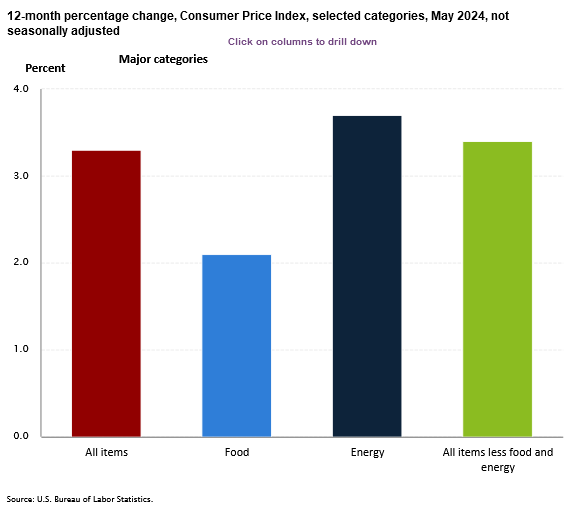 CPI Components This Month
The contributors to inflation have remained fairly consistent. However, the change in contribution from energy is noticeable this month. (Please note that the y-axis in both the graphs have different scales).
One Year Inflation Expectations
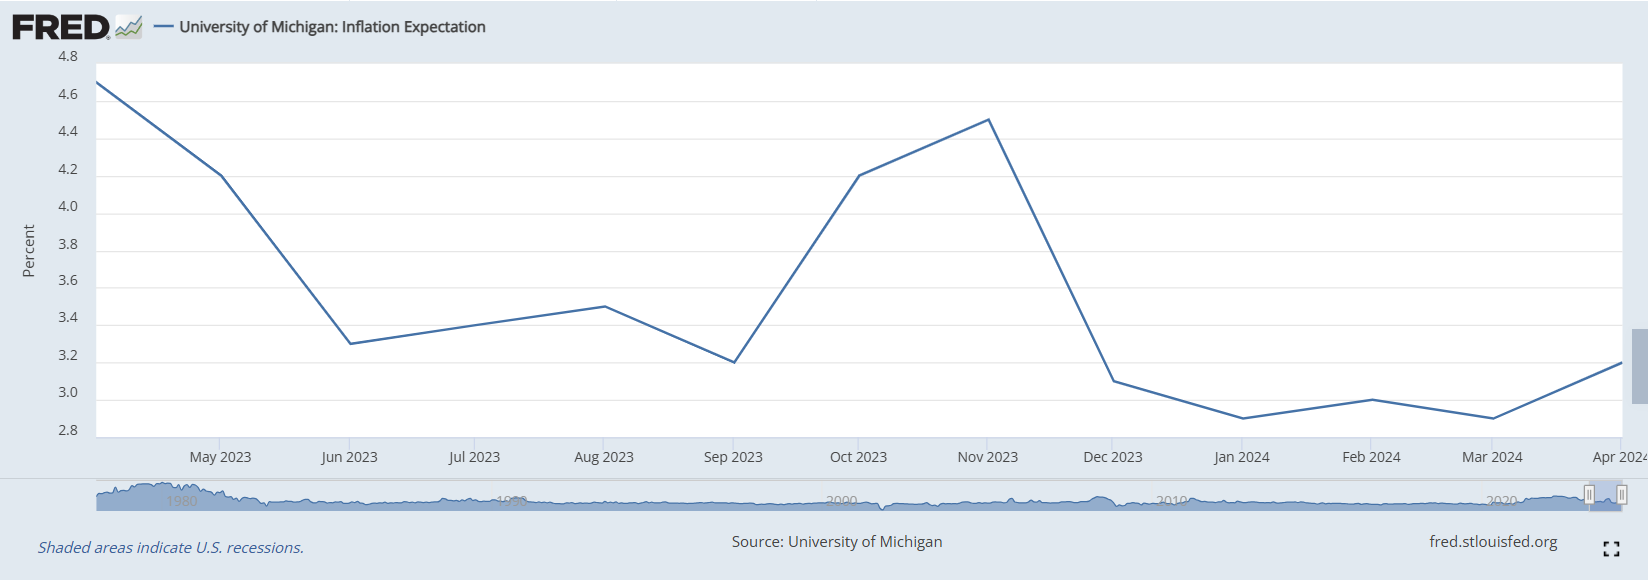
Sentiments
Consumer Sentiments
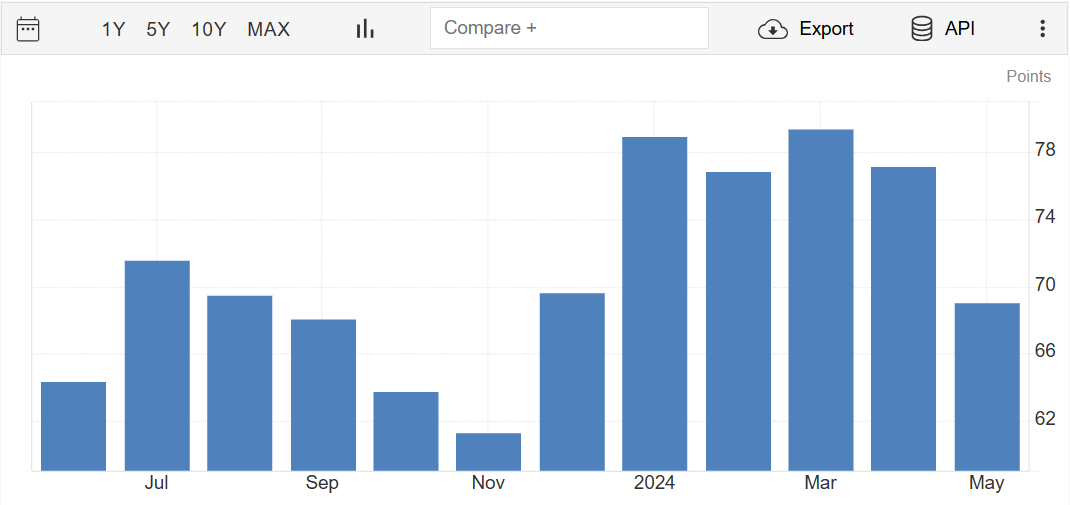
Investor Sentiments
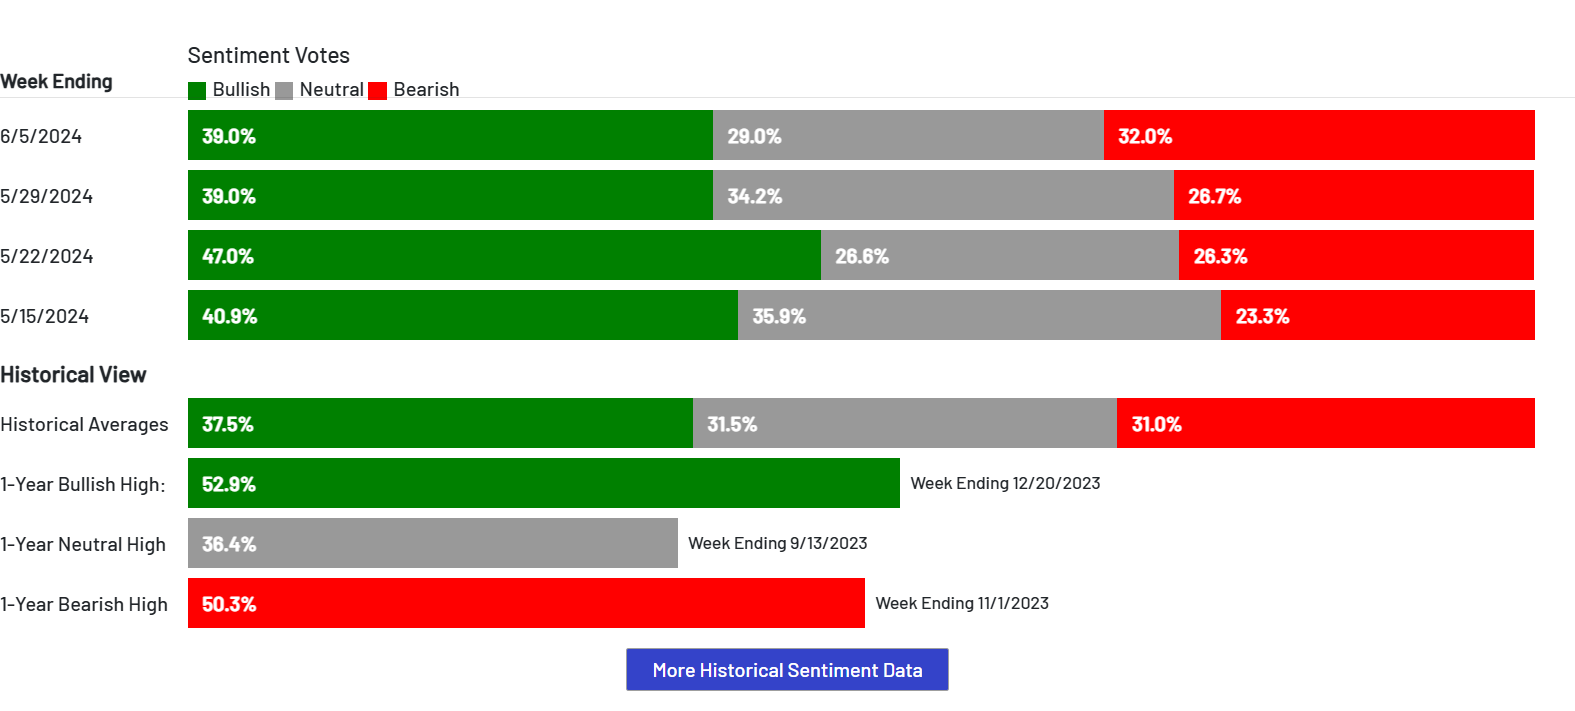
The AAII sentiment has remained consistently bullish even after the very short dip in S&P 500 in April.
GDP Factors
Manufacturing PMI
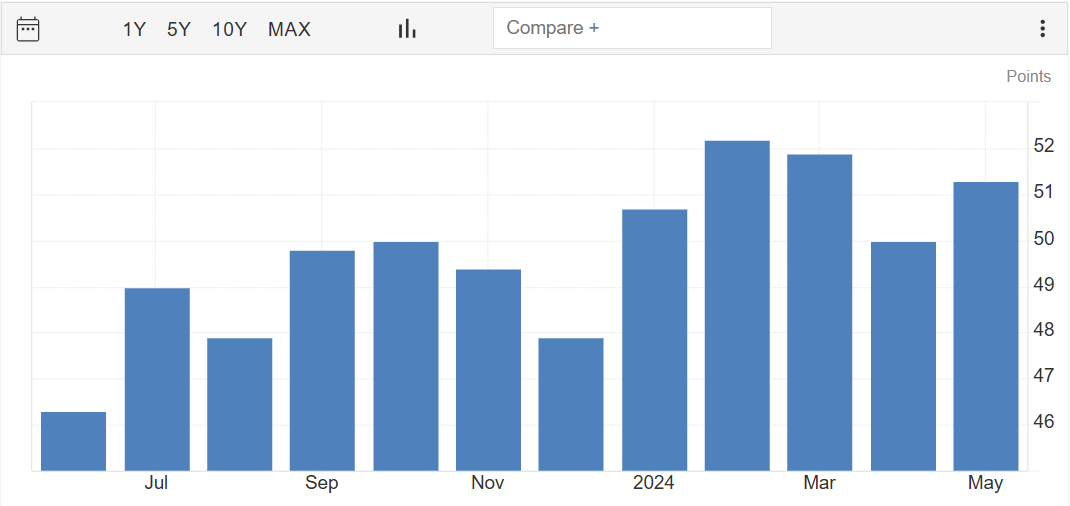
Services PMI
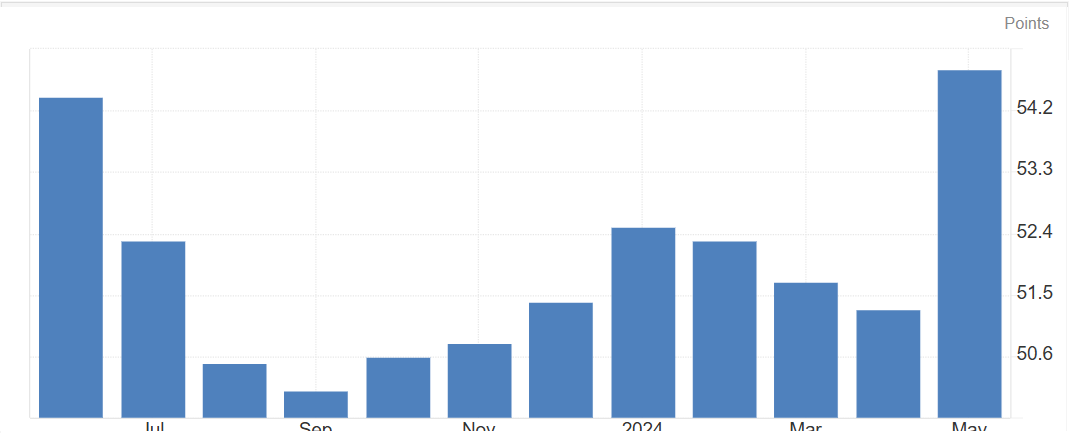
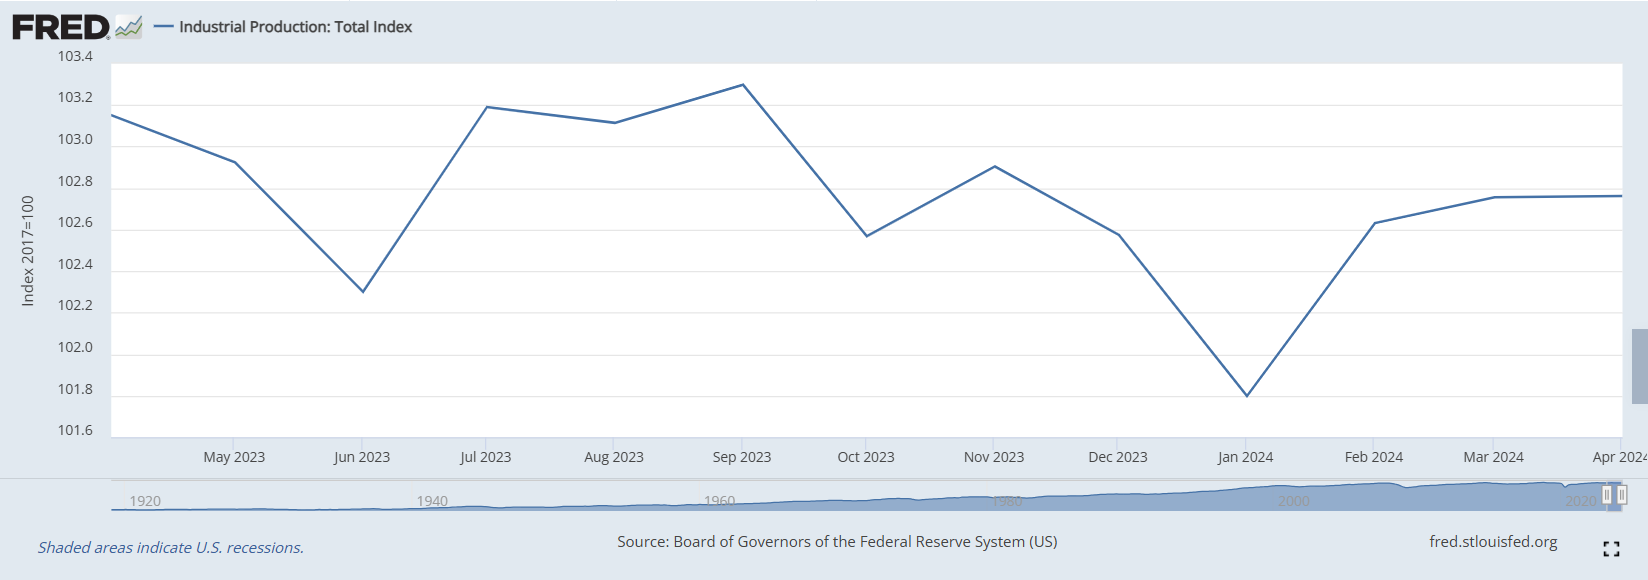
Industrial Production
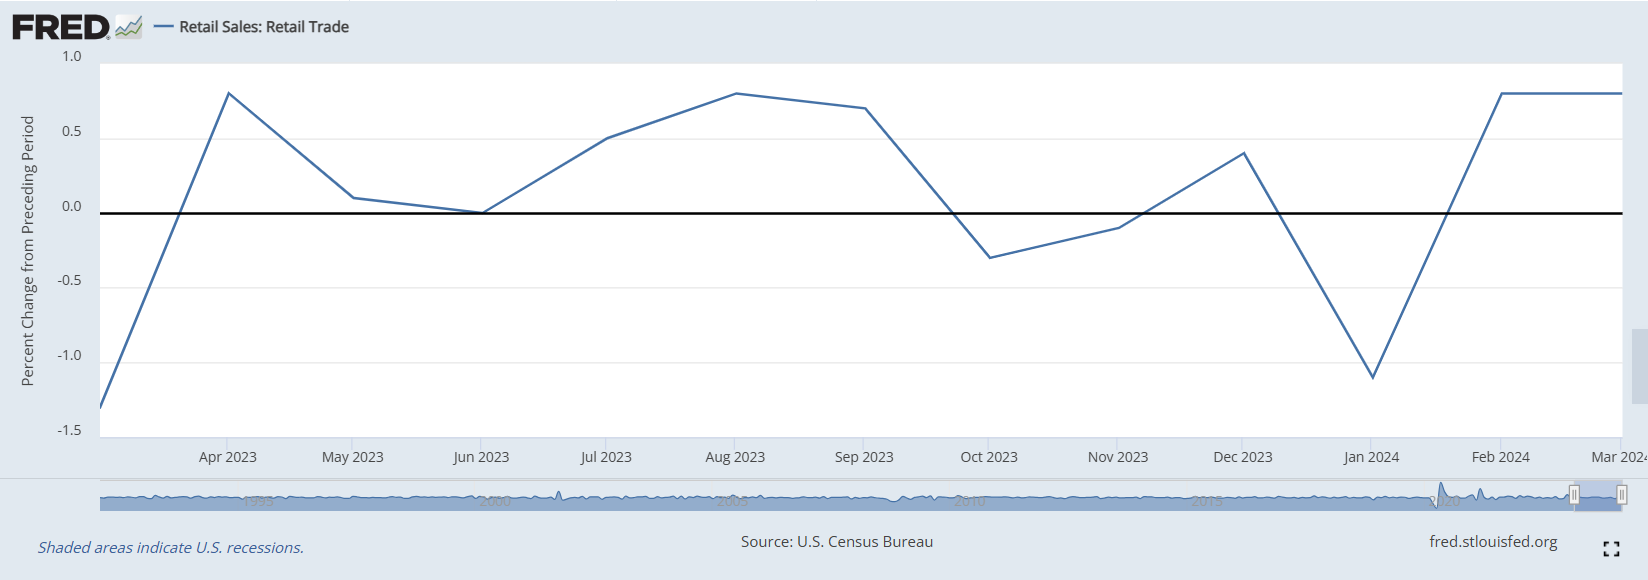
Retail Sales
Non-farm Payrolls
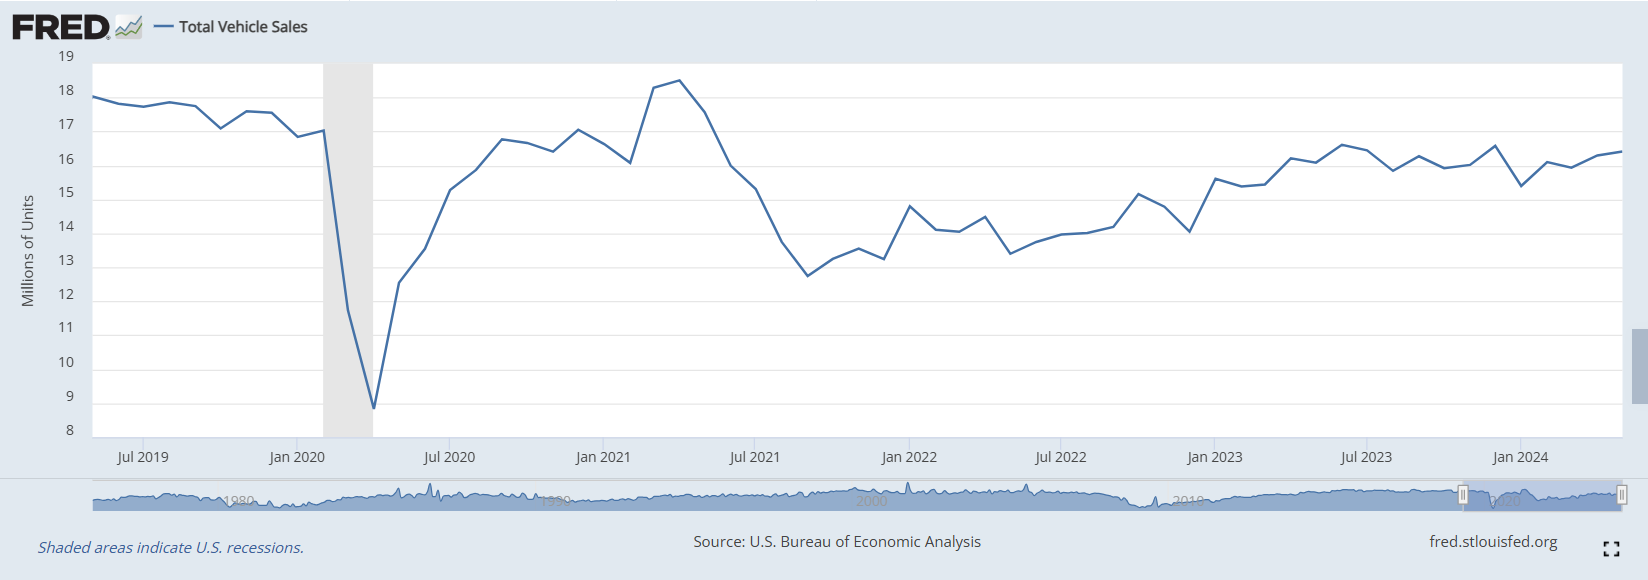
Total Vehicle Sales
Manheim Used Car Index
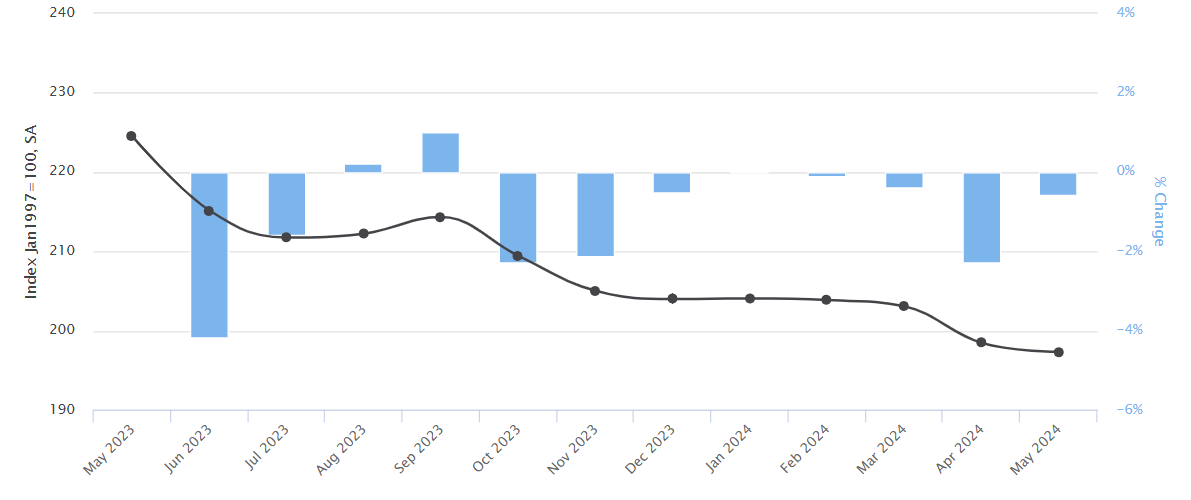
US New Home Sales
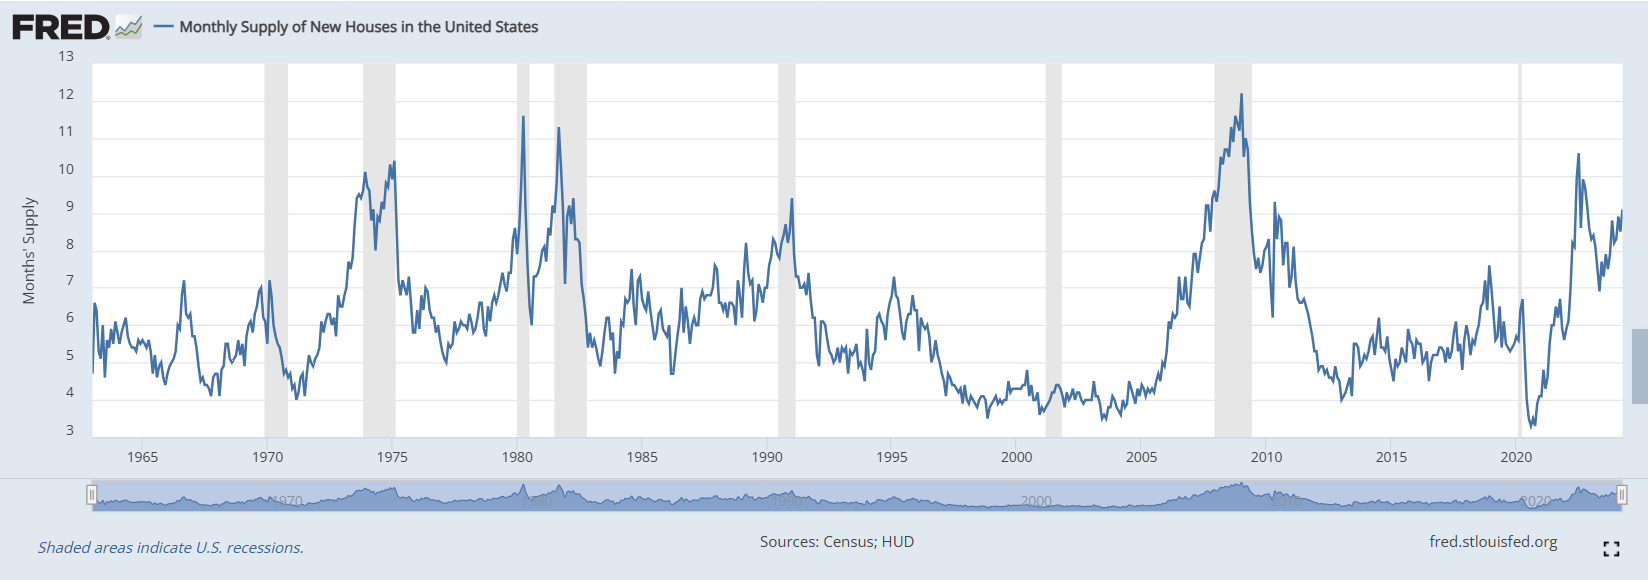
30 Year Fixed Mortgage Rates
The mortgage rates have followed the 10-year Treasury yield higher over the last few months. Recently as the inflation has resumed, so has the 10-year Treasury yield in response. You can see the slight rise in mortgage rates in May as a consequence. Only in the last week or so, the 10-year is moderating.
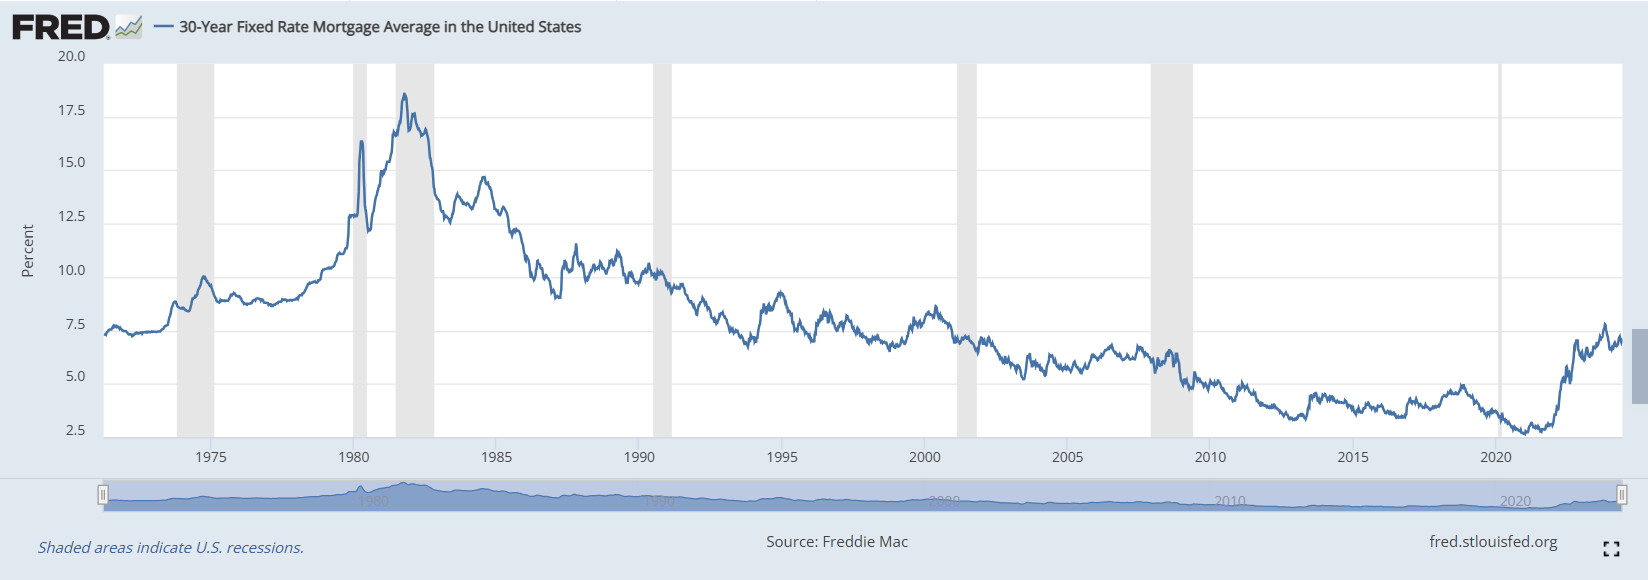
Employment Indicators
Historical Unemployment Rate
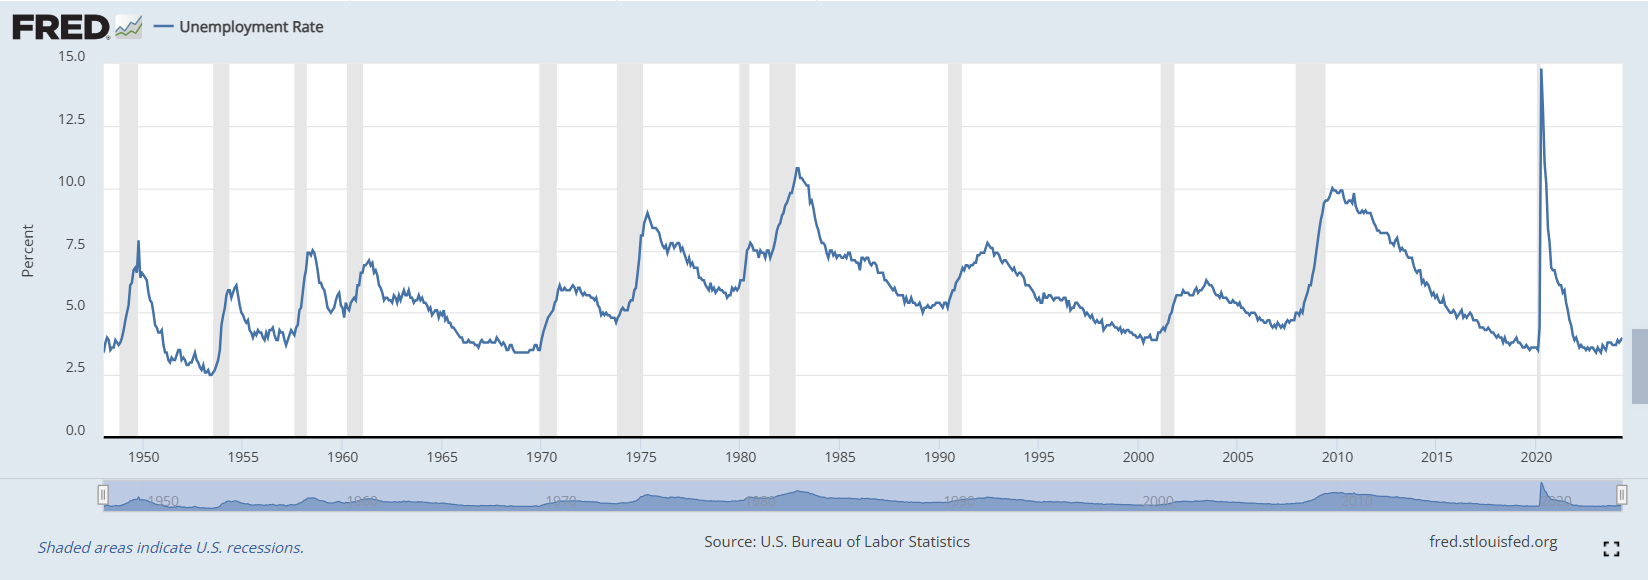
US Jobless Claims
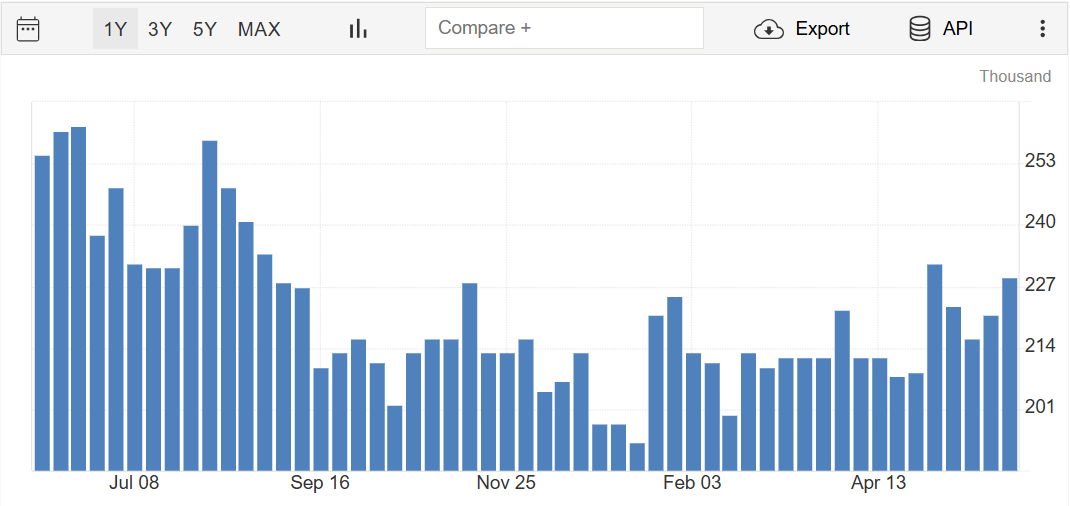
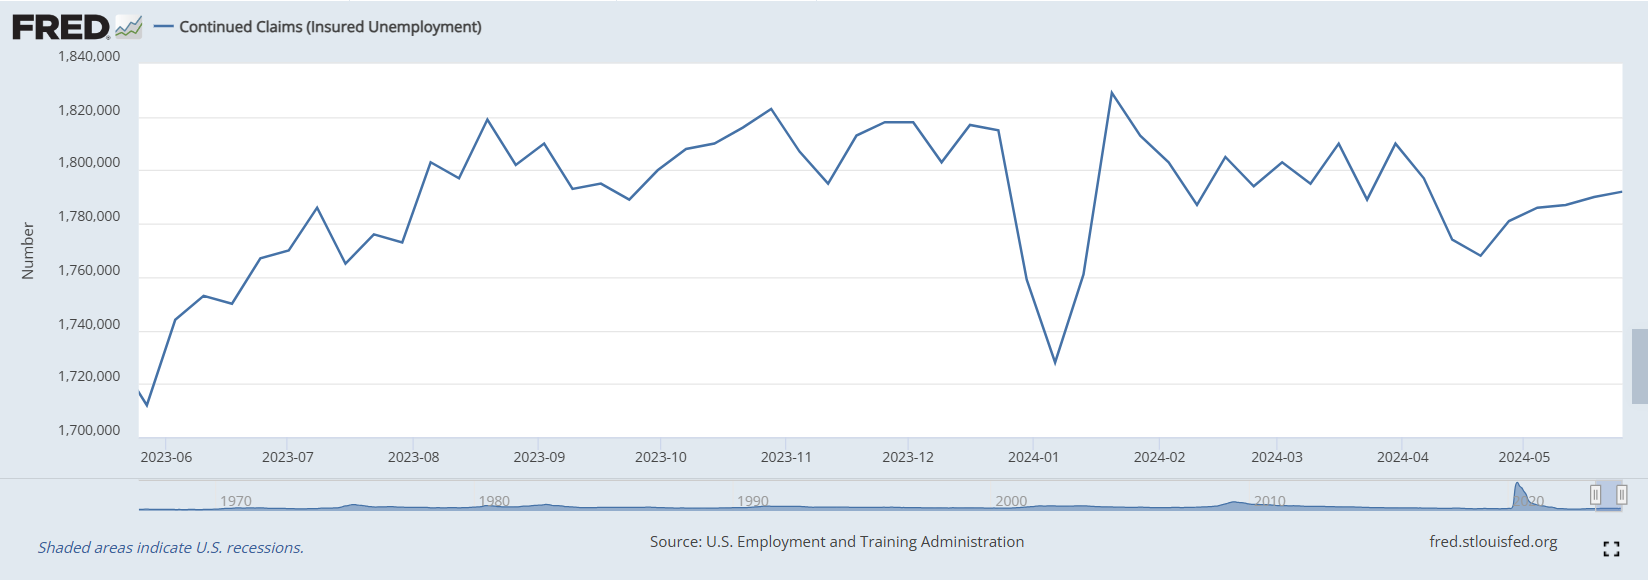 This chart will be the first indicator of a telltale sign that unemployment is increasing. As you see the continuing
jobless claims number rise, it implies the people who lost their jobs are not going back to labor force fast enough
and the unemployment rate is starting to creep higher. Over the last couple of weeks, it has trended a bit higher and
worth watching over the next few months.
This chart will be the first indicator of a telltale sign that unemployment is increasing. As you see the continuing
jobless claims number rise, it implies the people who lost their jobs are not going back to labor force fast enough
and the unemployment rate is starting to creep higher. Over the last couple of weeks, it has trended a bit higher and
worth watching over the next few months.
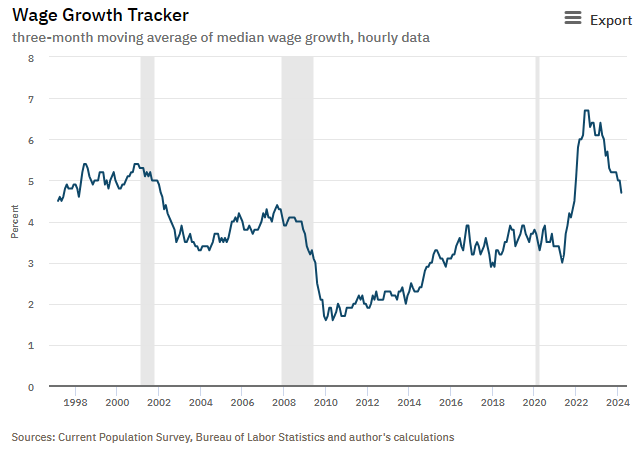
Wage Growth Tracker
Market Indicators
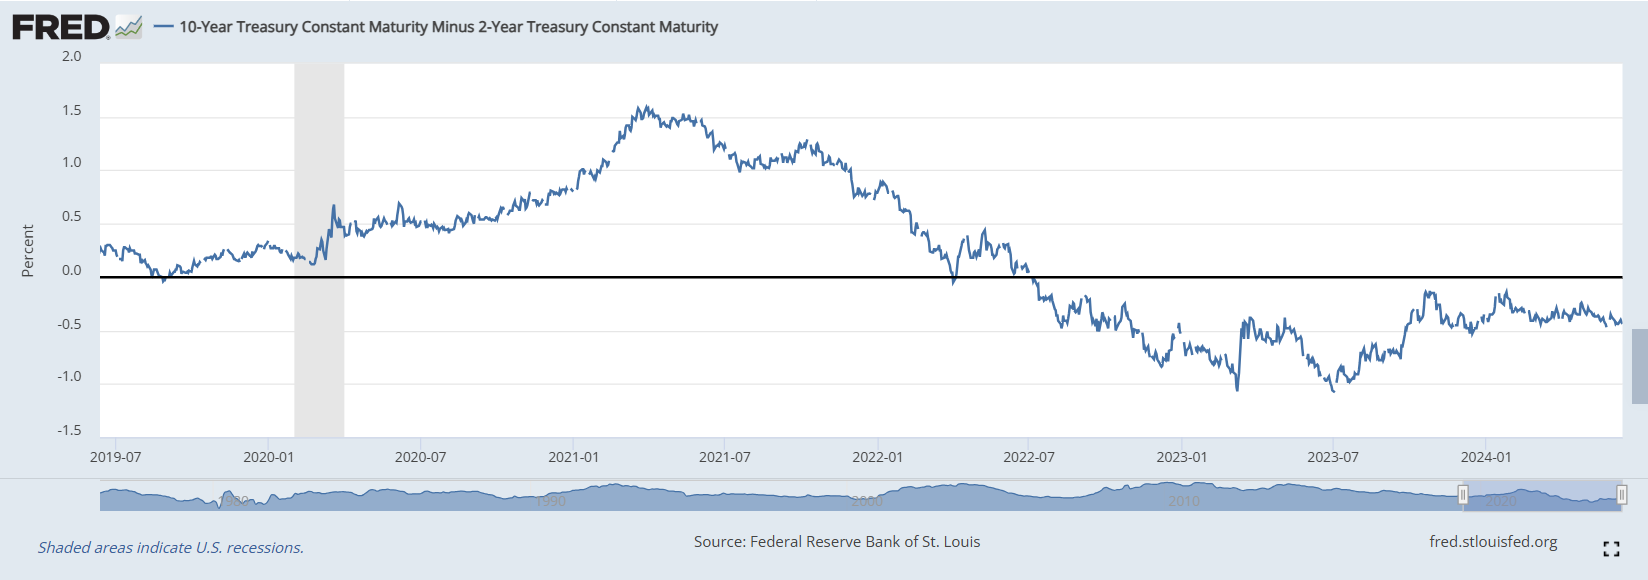
Yield Curve Inversion
Yield Curve - then and now
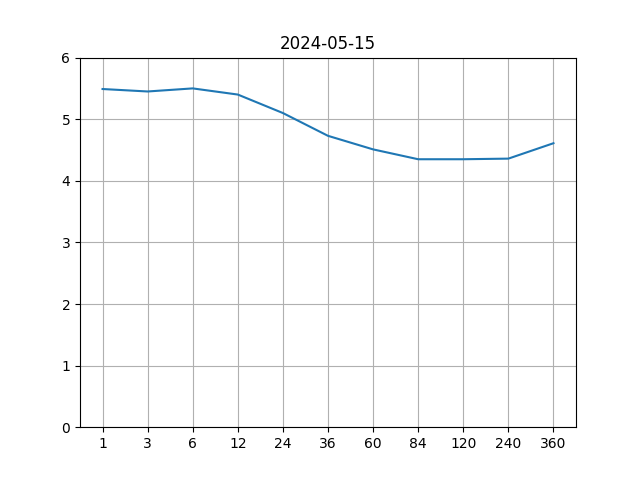 Yield curve - Then
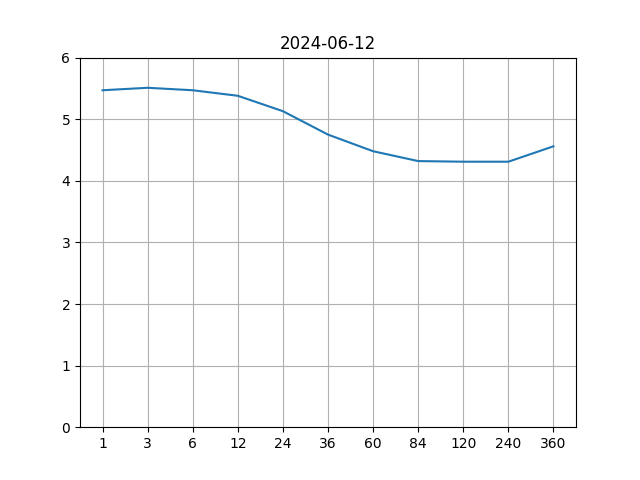 Yield curve - Now
 Notice how the 10 year and beyond part of the curve has lowered a bit after the FED's dovish comments in the last FOMC meeting. Otherwise, the curve looks fairly identical to the curve one month ago.
Market Sectors
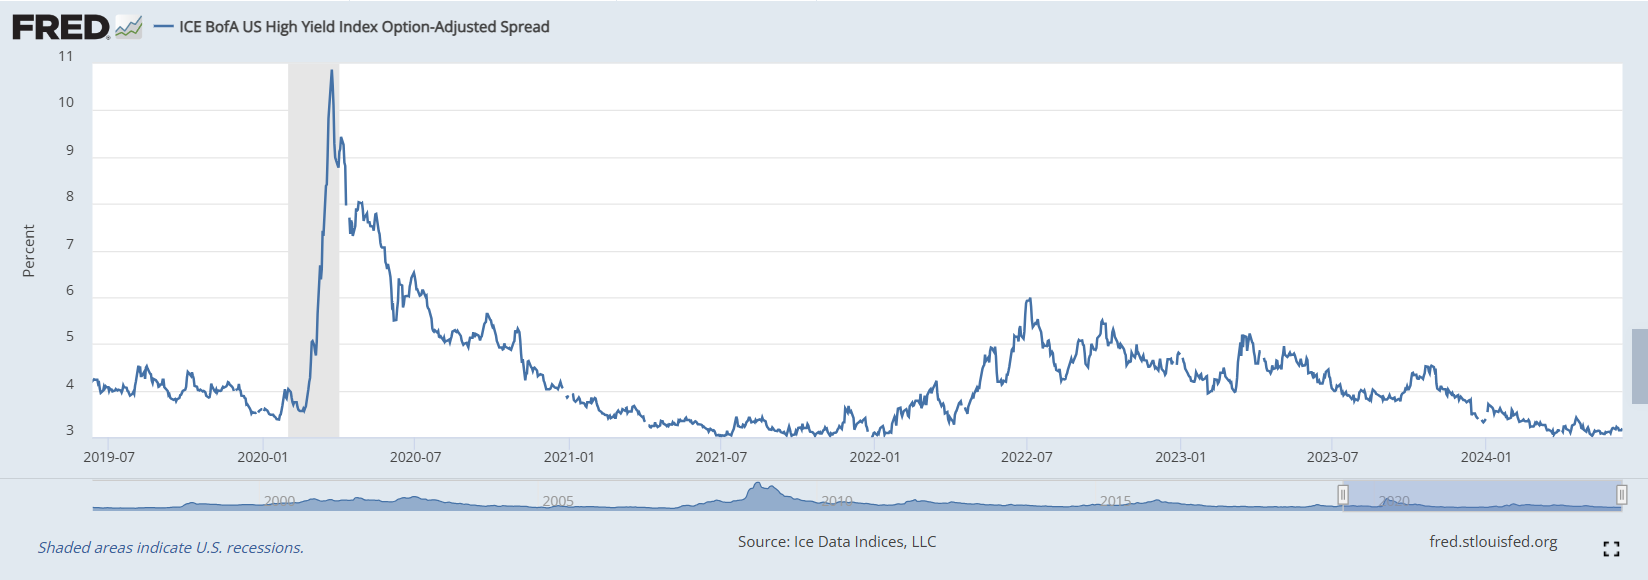
High Yield Index Options-Adjusted Spread
If the economy were to enter a recession, it is likely that some of the companies will struggle to keep up with their debt payments causing their credit spread to widen. This indicator shows how the credit spreads have been behaving so far.
The tight spread indicate that the soft landing narrative is actually playing out.
Put Call Ratio
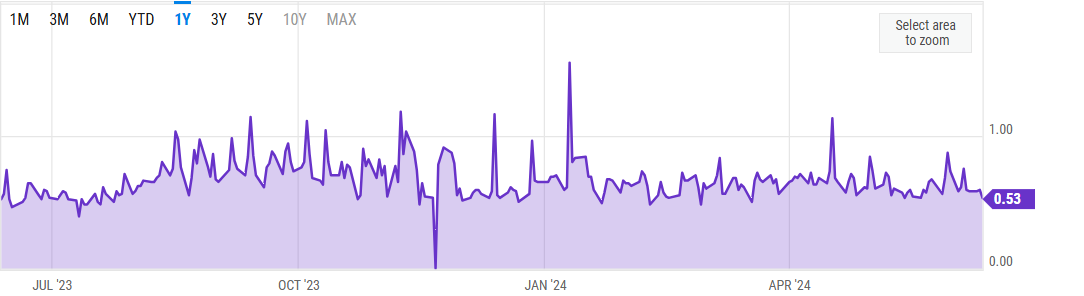
A spike in put / call ratio indicates that investors are very apprehensive about a sudden fall in the equity markets. In April/May, we have not seen any interesting activities.
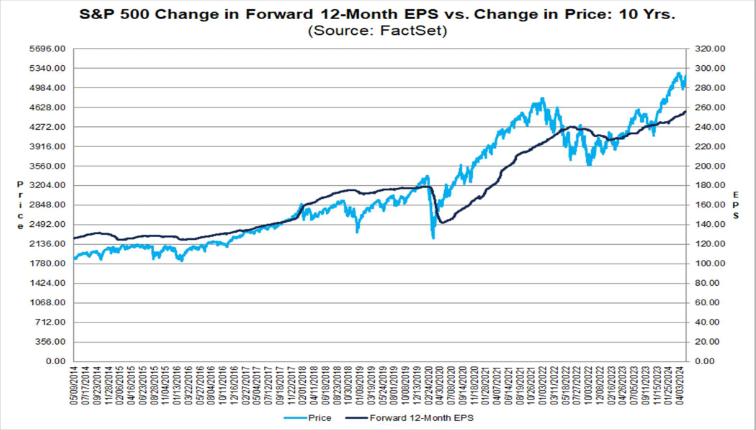
S&P 500 Current Valuations
The current earnings forecast by equity analysts estimate the earnings potential for S&P 500 companies to be around $255 which translates to a price to earnings ratio of 20.7 at the current S&P 500 price level. This is above the 5 year and the 10 year averages. The market is looking pricier by the day.
Diclosures
- Trillium Square Advisors LLC is a registered investment adviser offering advisory services in the state of North Carolina and in other jurisdictions where exempted. Registration as an investment adviser does not imply a certain level of skill or training, and the content of this communication has not been approved or verified by the United States Security and Exchange Commission or by any state securities authority.
- Information presented is for educational purposes only and does not intend to make an offer or solicitation for the sale or purchase of any specific securities, investments or investment strategies. Market data, articles and other content in this presentation are based on generally available information and are believed to be reliable. Trillium Square does not guarantee the accuracy of the information contained in this presentation. The information is of a general nature and should not be construed as investment advice and relied upon in making investment decisions.
- Investments involve risk and are never guaranteed. Be sure to first consult with a qualified financial adviser before implementing any strategies discussed herein.
- Past performance is not indicative of future performance.
- The content of this communication and any accompanying documents are not to be copied, excerpted or distributed without express written permission of the firm. Any other use beyond its author’s intent, distribution or copying of the contents of this presentation is strictly prohibited. Nothing in this document is intended to be legal, accounting, or tax advise, and is for informational purposes only.
- Hypothetical performance results have many inherent limitations. No representation is being made that any account will or is likely to achieve profits or losses similar to those shown. In fact, there are frequently sharp differences between hypothetical performance results and the actual results subsequently achieved by any particular investment strategy. Hypothetical performance for illustration purposes only.
- Trillium Square will provide all prospective clients with a copy of our current Form ADV, Part 2A (Disclosure Brochure) upon request. At anytime you can view our current Form ADV, Part 2A at https://adviserinfo.sec.gov
© Copyright Trillium Square Advisors LLC. All rights reserved.
Trillium Square Advisors LLC,
423 Peaslake Ct, Rolesville NC - 27571
Trillium Square Advisors LLC,
2840 Plaza Place, Suite 210, Raleigh, NC - 27612