Broad Indicators
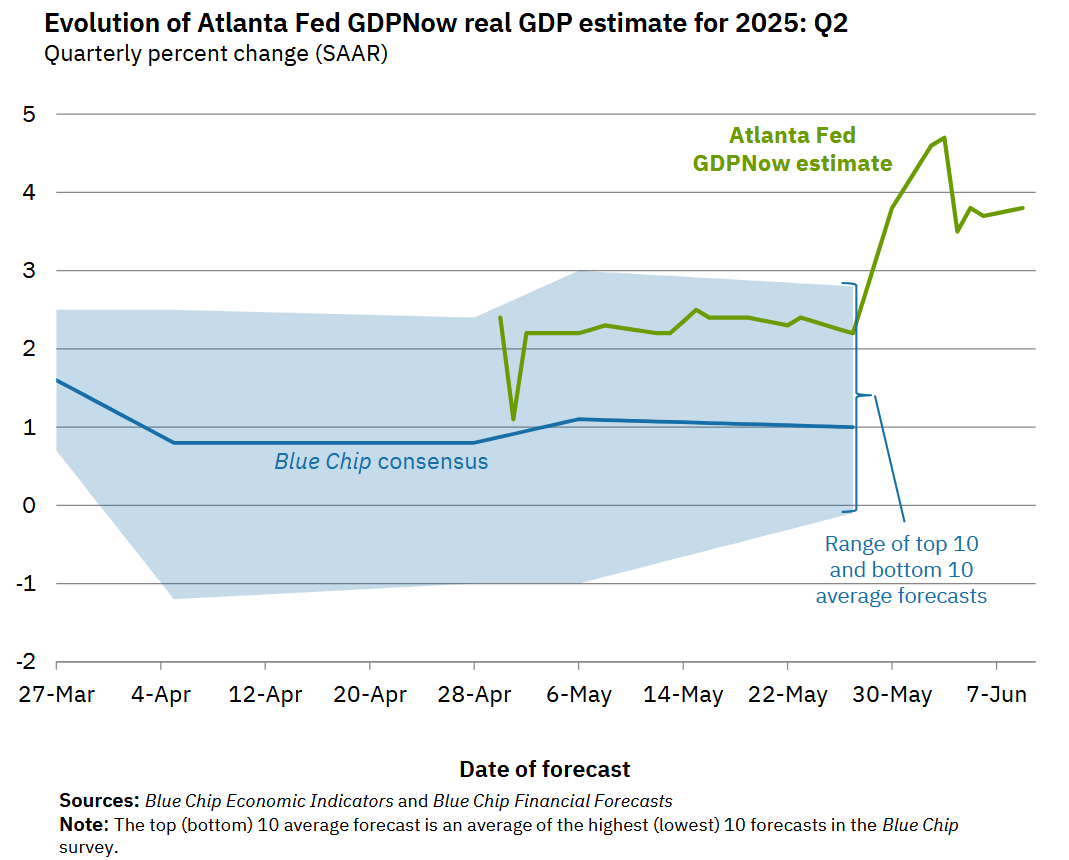
Atlanta GDP NowCast
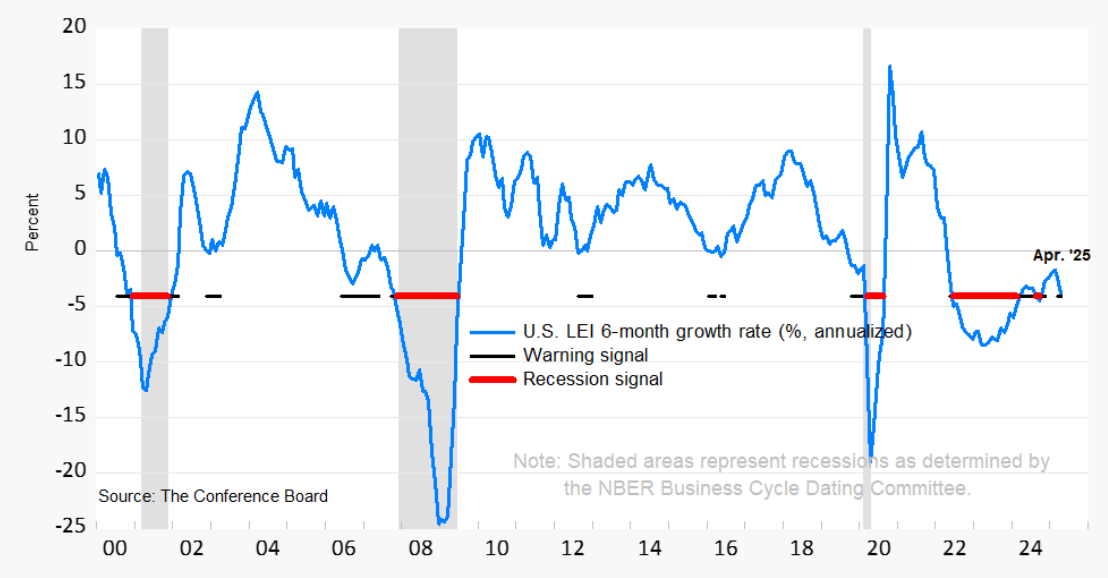
Conference Board's Leading Economic Indicator
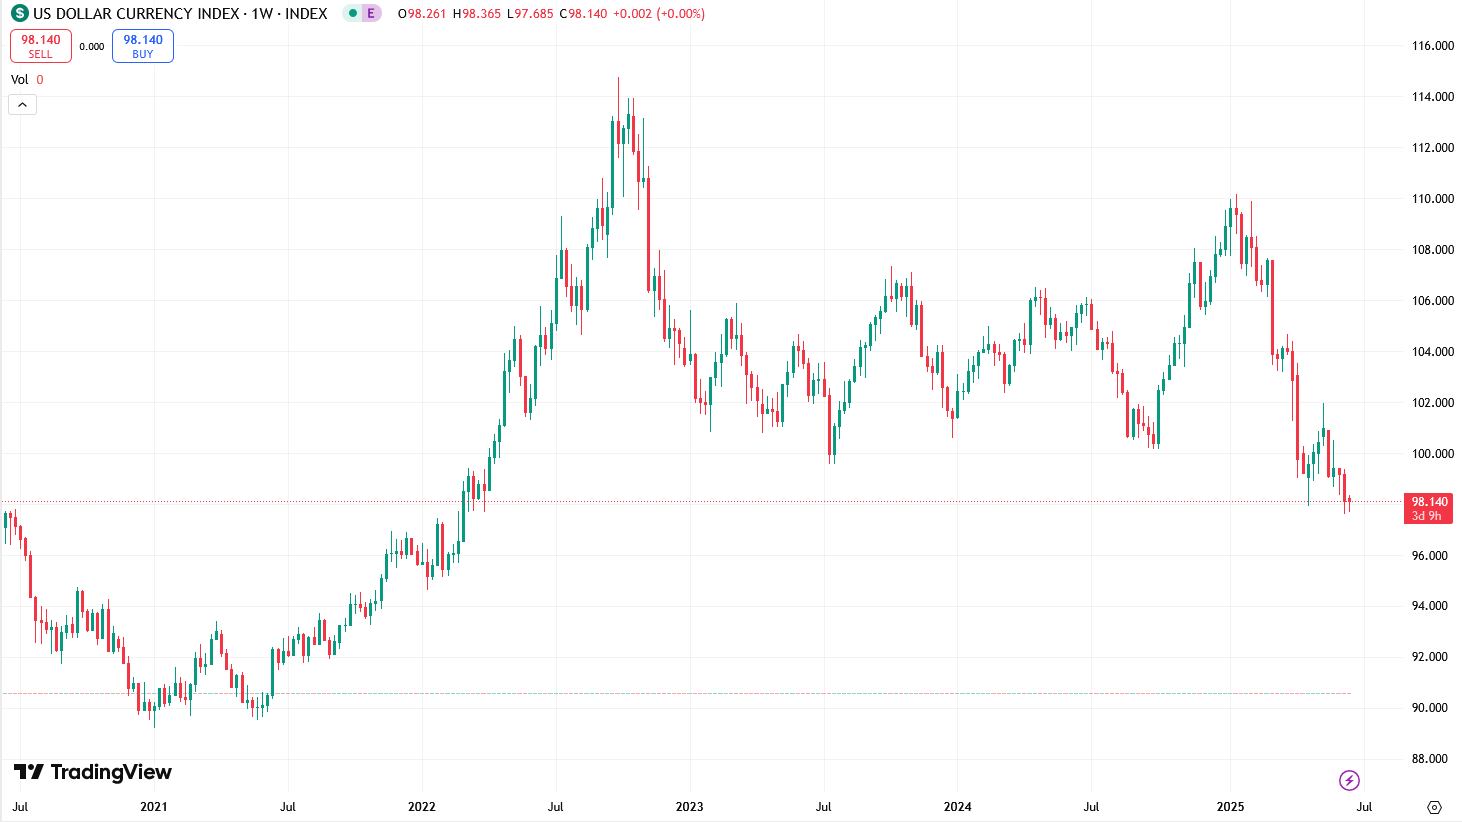
US Dollar Index
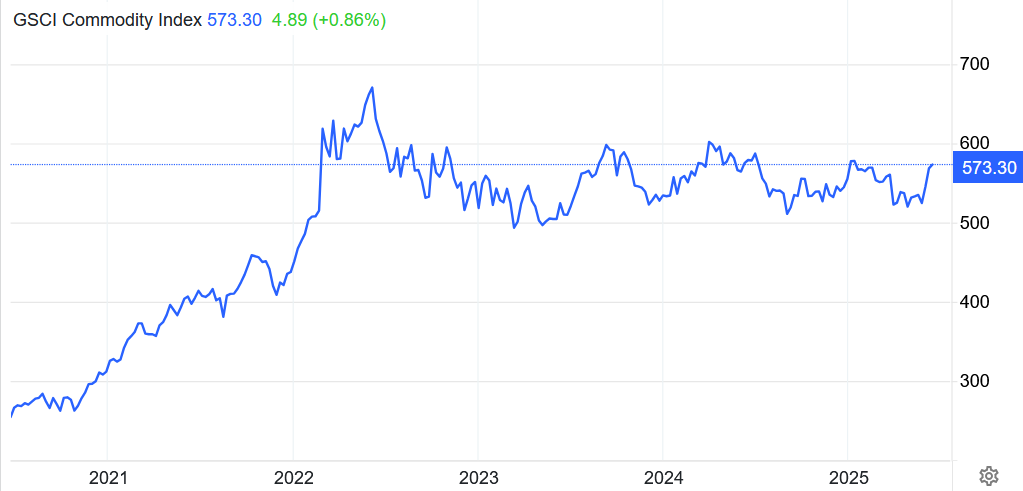
Commodities
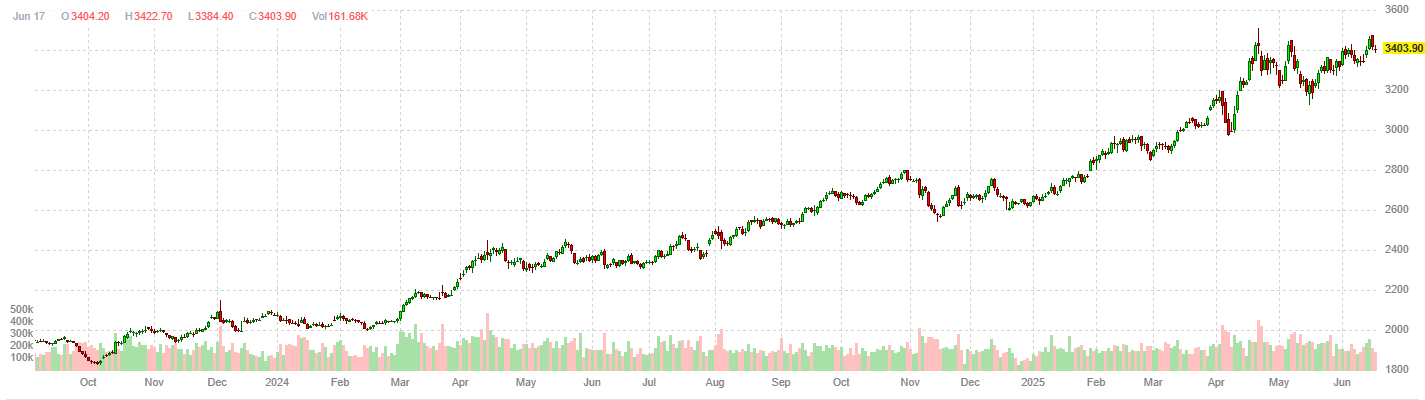
Gold
Gold has been marching higher steadily with the 10 year rates climbing.
Bitcoin
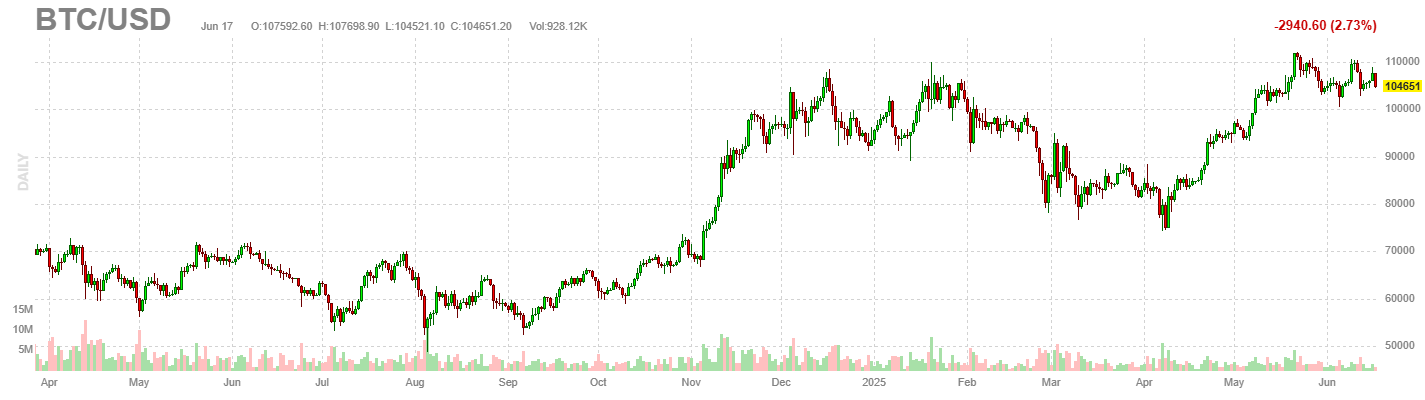
BitCoin continues to behave like a risk asset. It has shot up to its previous all time high since the deal with China on tariffs.
Inflation
CPI Month over Month
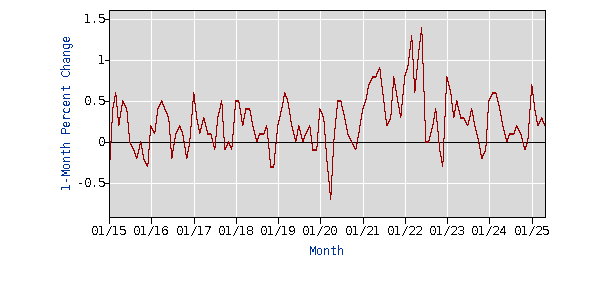
PPI Month over Month
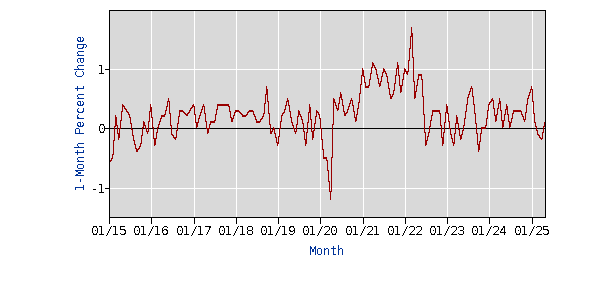
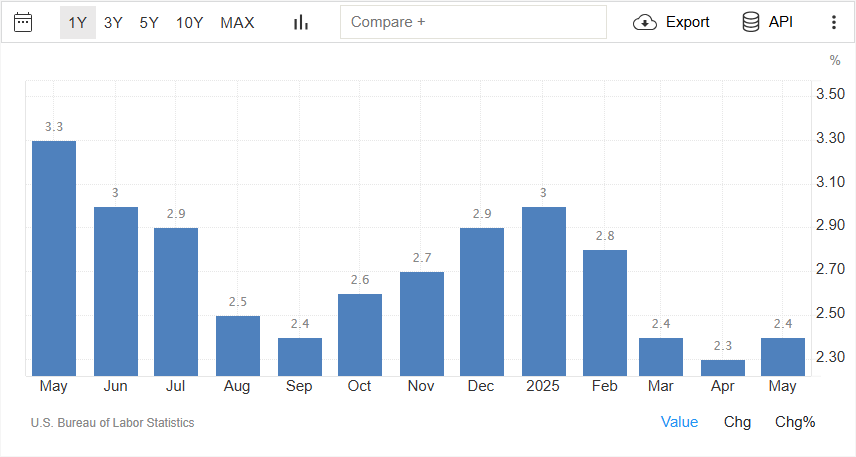
Reported Year over Year Inflation Rate
CPI Components
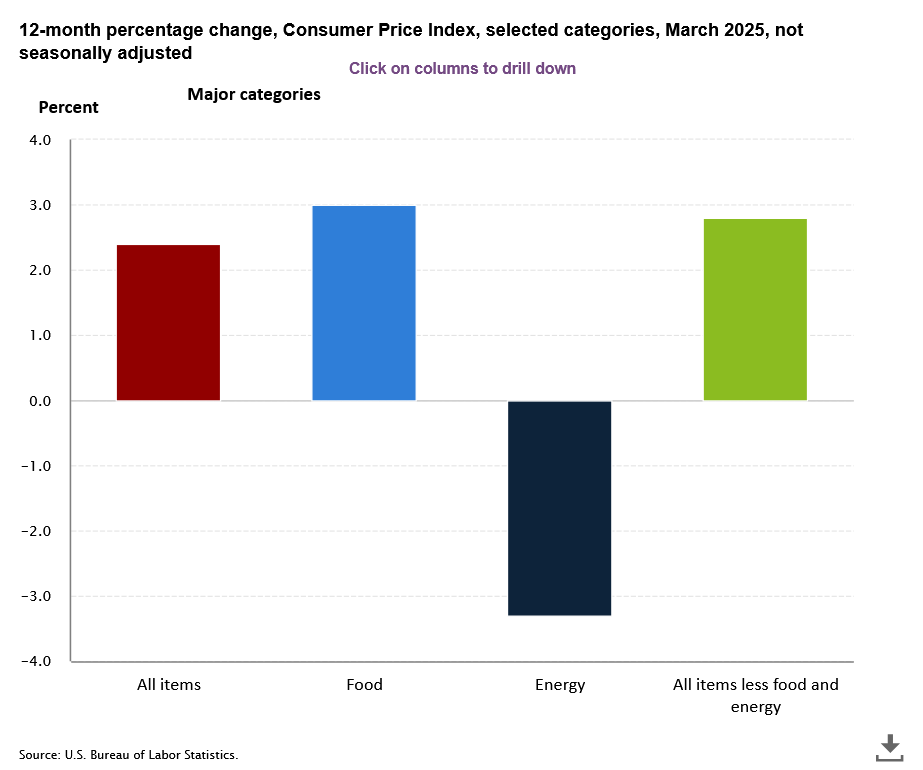 CPI Components Last Month
Source BLS.gov Consumer Price Index
CPI Components Last Month
Source BLS.gov Consumer Price Index
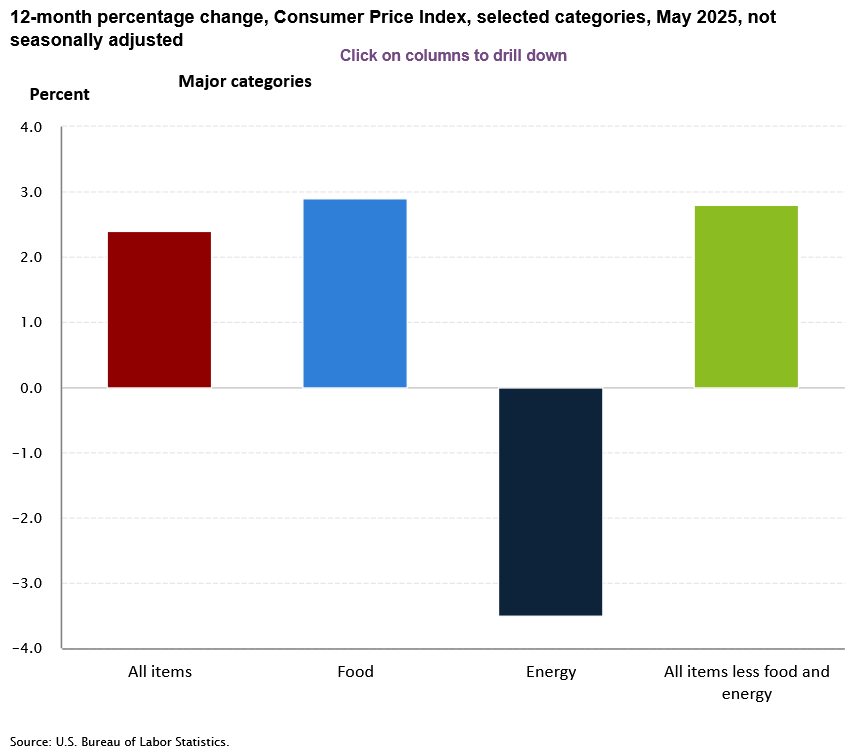 CPI Components This Month
The contributors to the inflation have been mainly food and transportation. The decline in energy prices have helped tame inflation. (Please note that the y-axis in both the graphs have different scales).
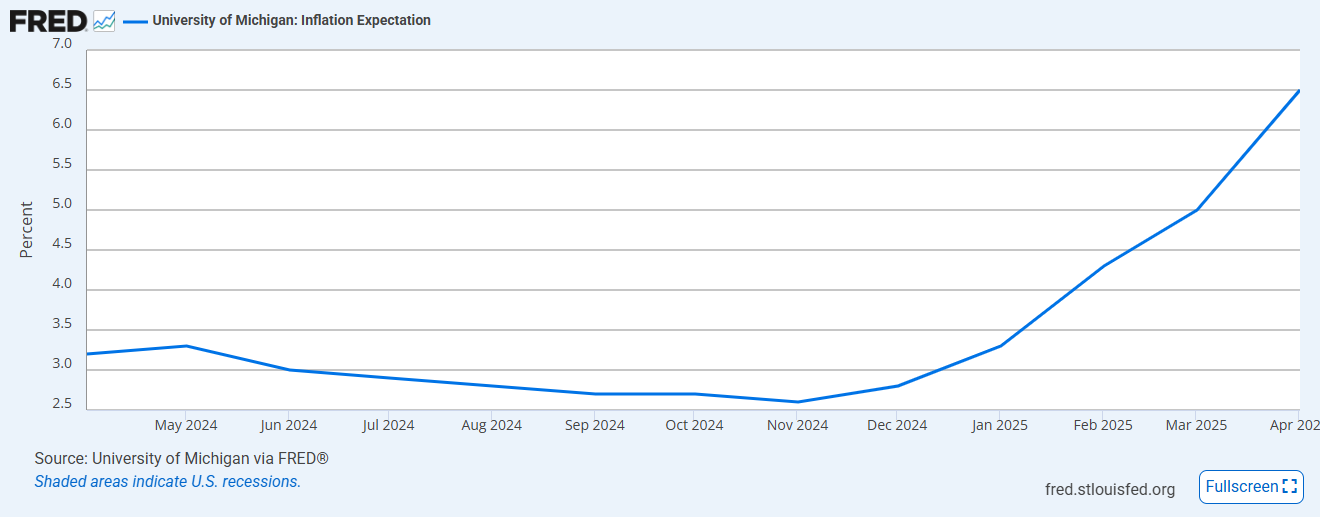
One Year Inflation Expectations
Sentiments
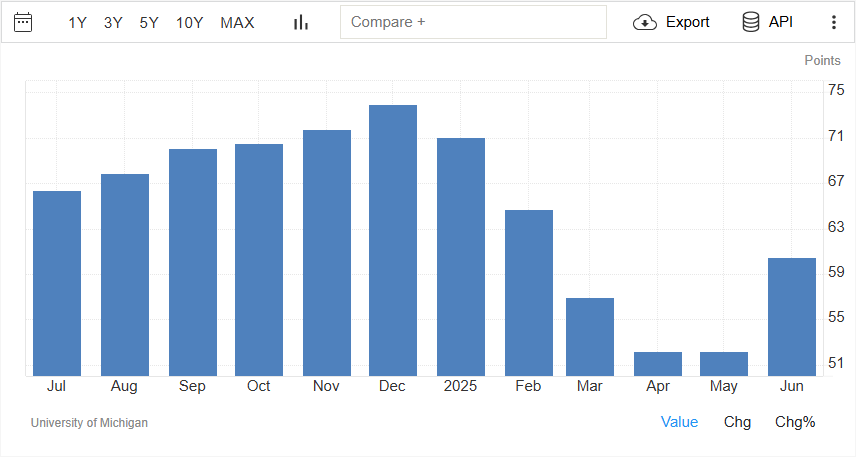
Consumer Sentiments
Investor Sentiments
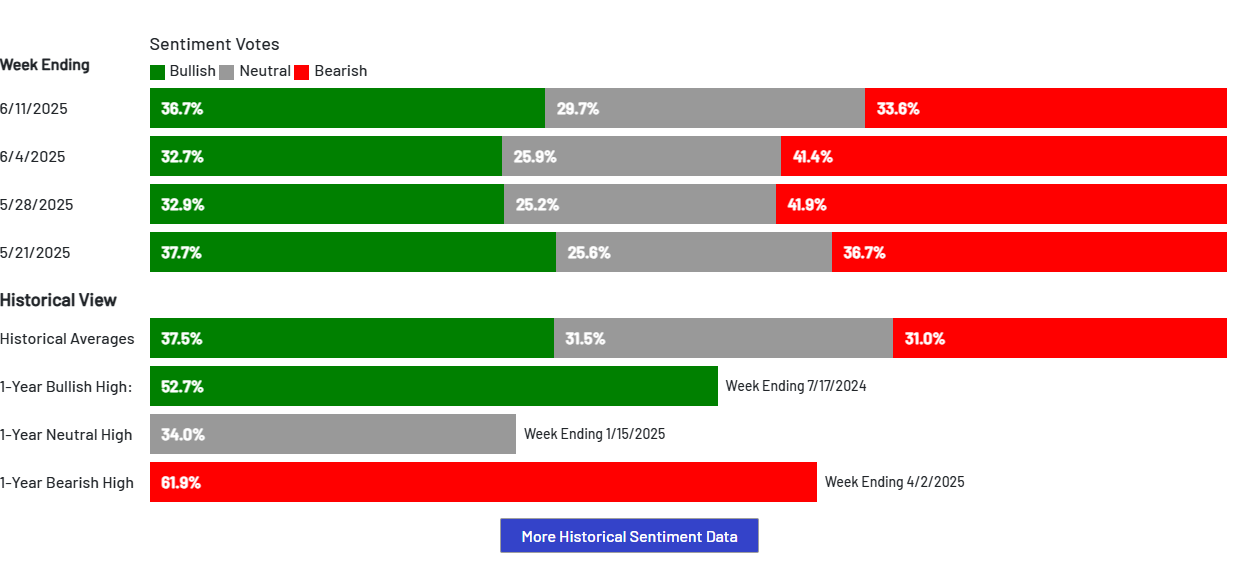
The AAII sentiment has been rebounding from a bearish stance a month ago.
GDP Factors
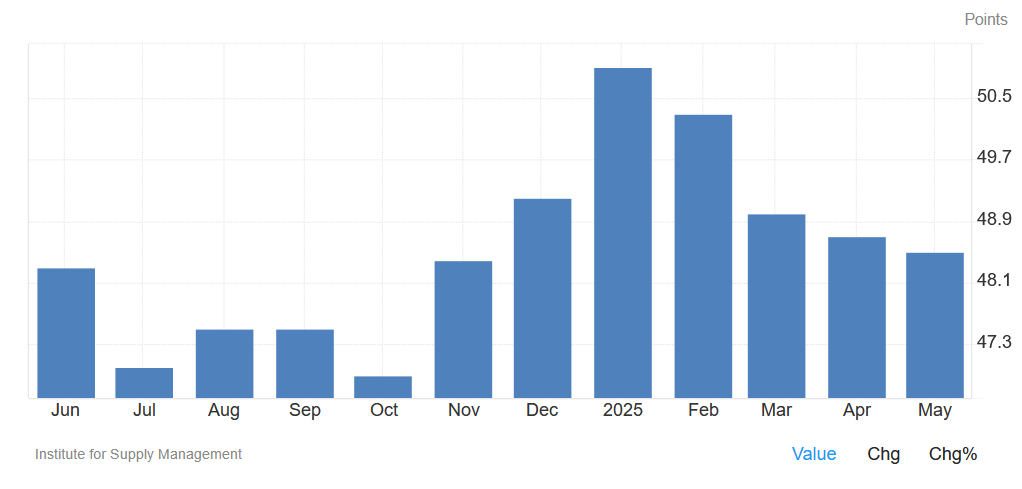
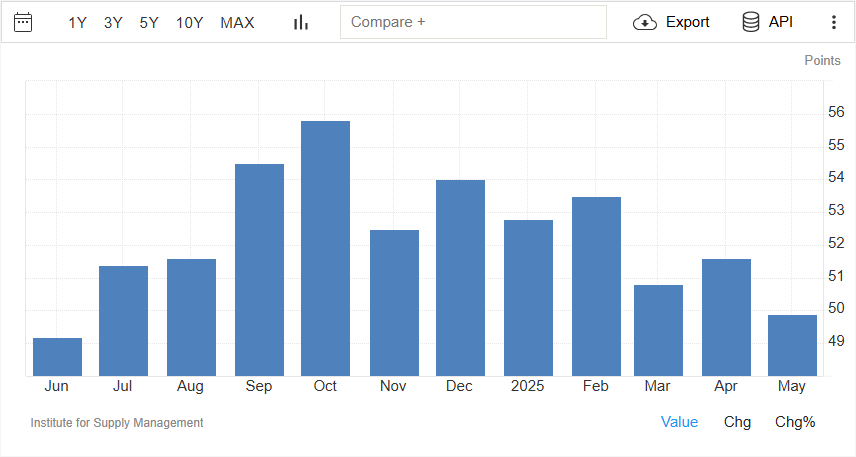
Manufacturing PMI
Services PMI
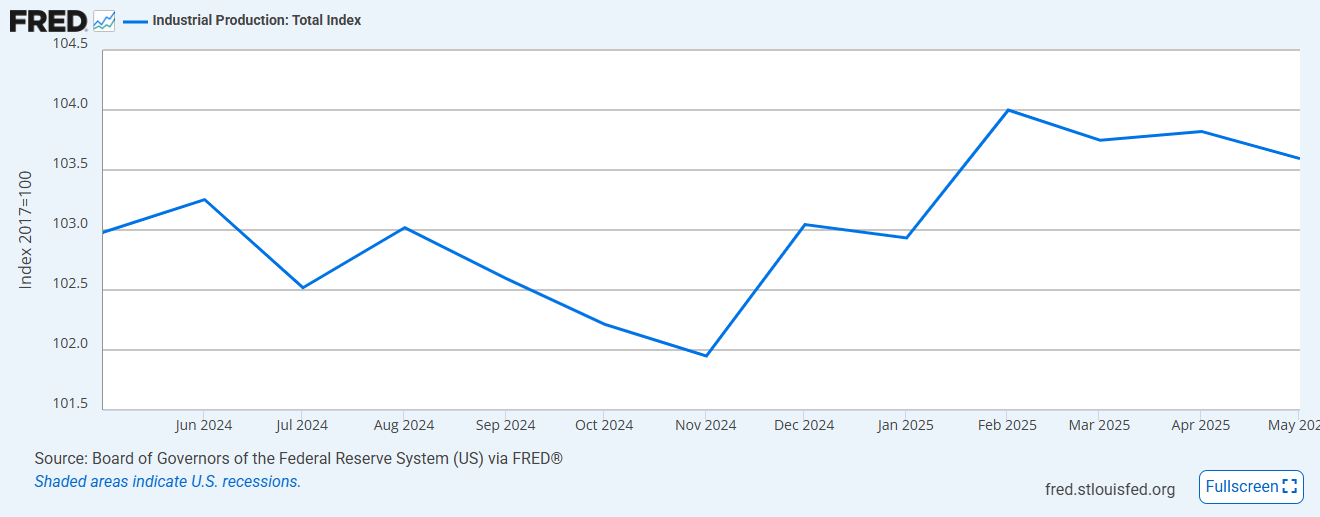
Industrial Production
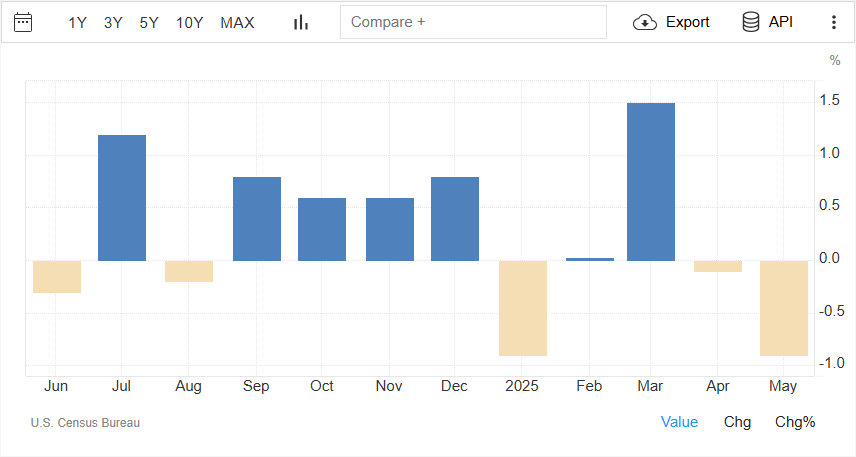
Retail Sales
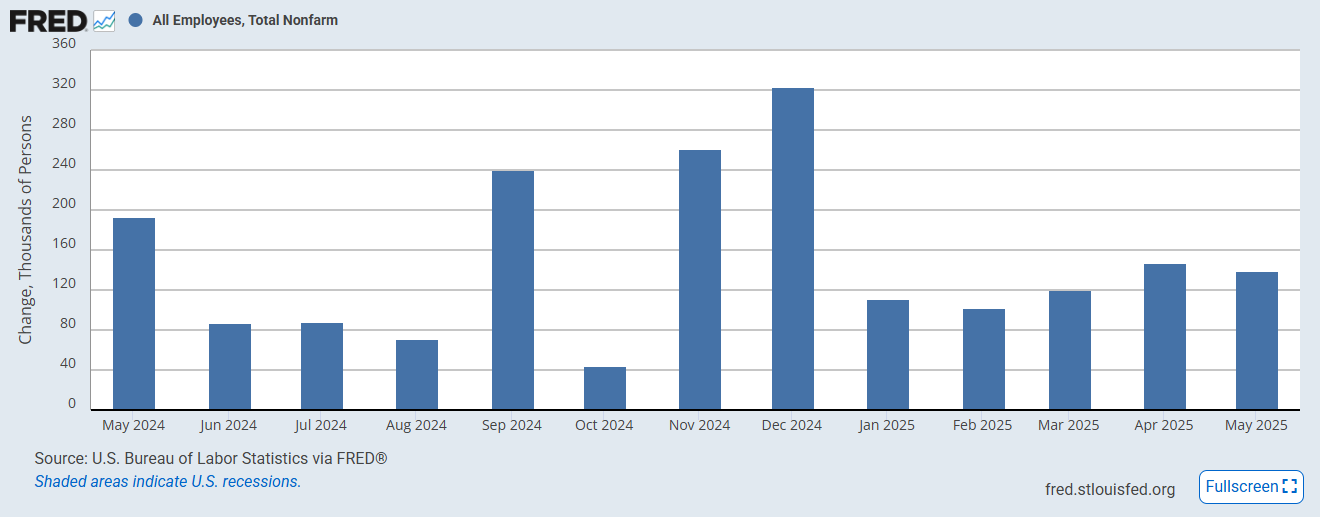
Non-farm Payrolls
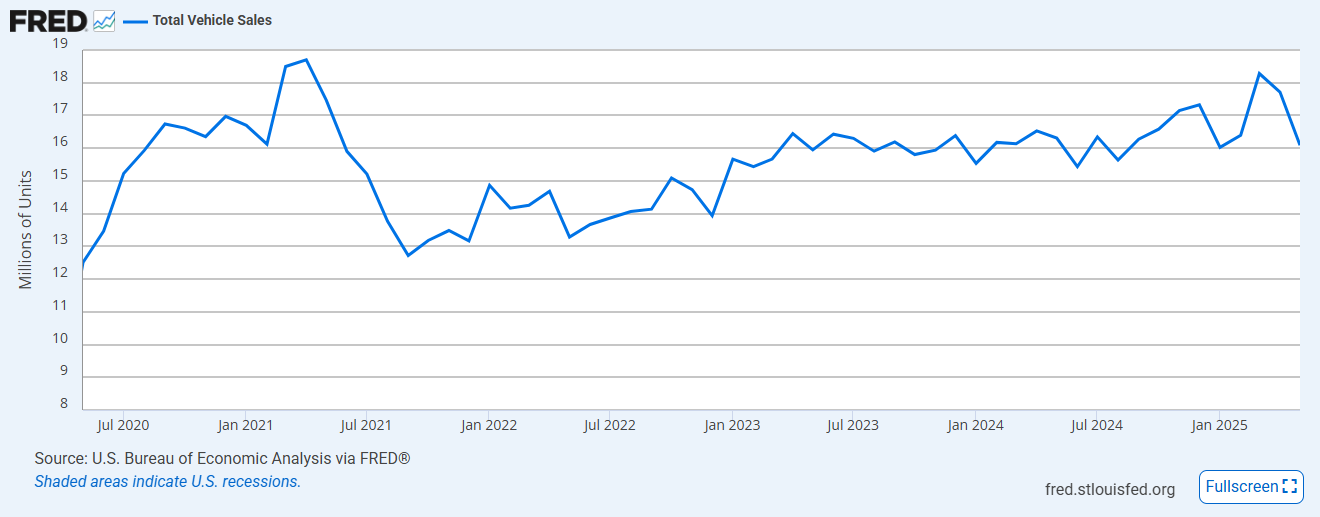
Total Vehicle Sales
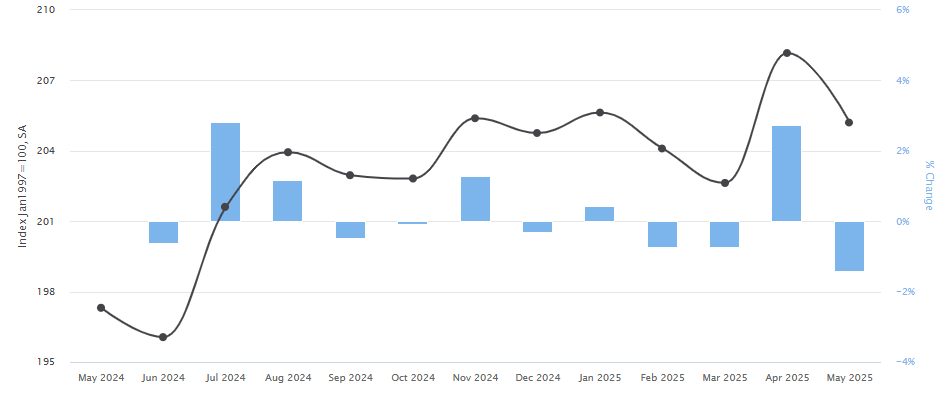
Manheim Used Car Index
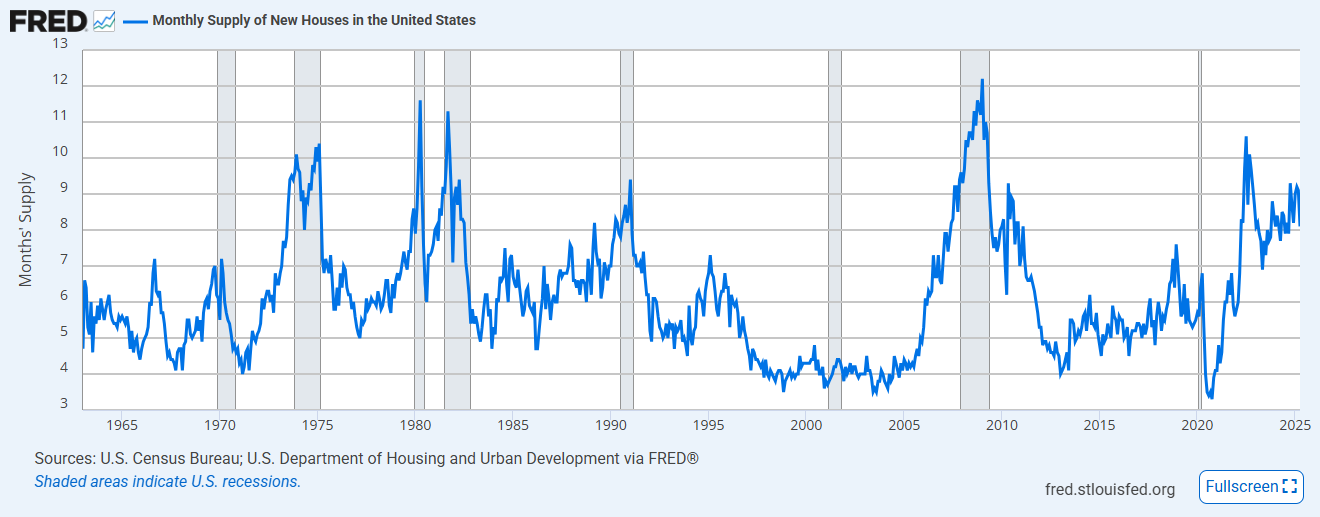
US New Home Sales
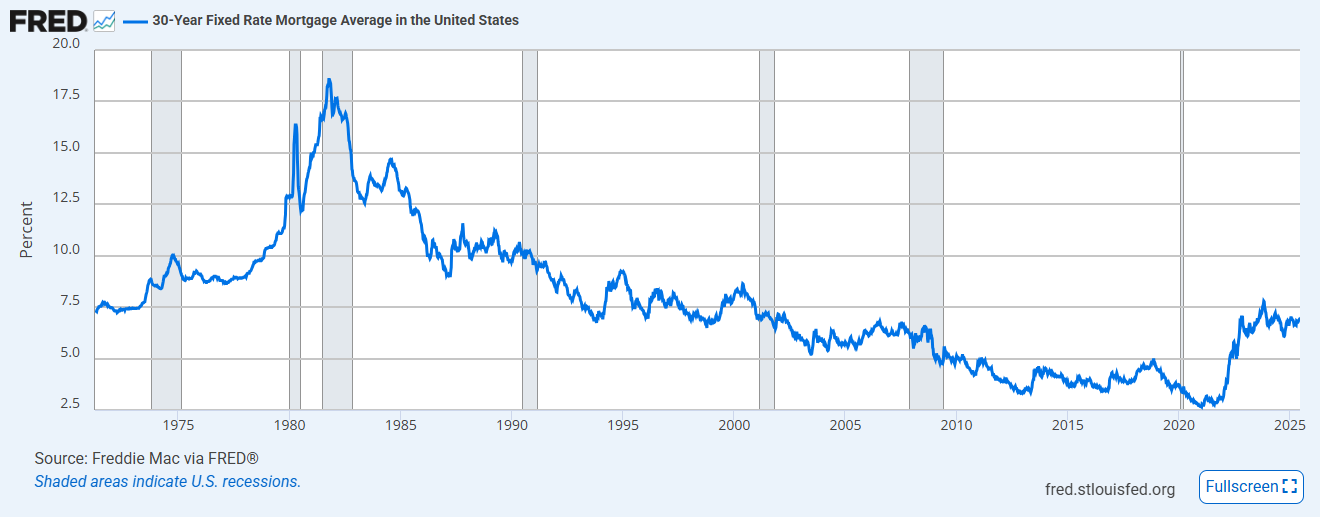
30 Year Fixed Mortgage Rates
The mortgage rates have followed the 10-year Treasury yield higher over the last few weeks.
Employment Indicators
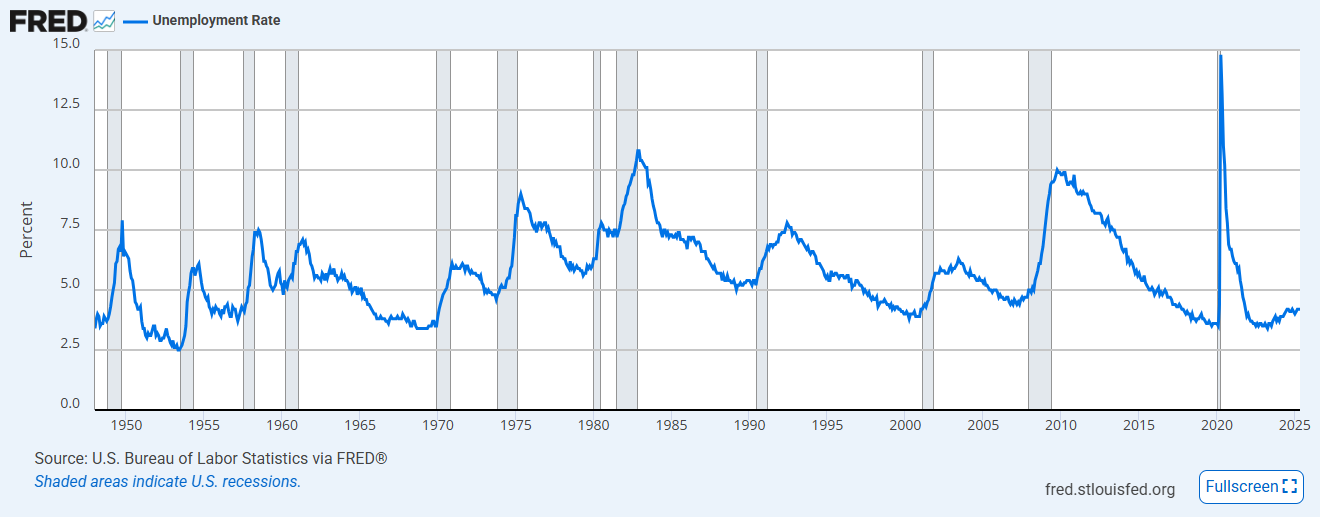
Historical Unemployment Rate
US Jobless Claims
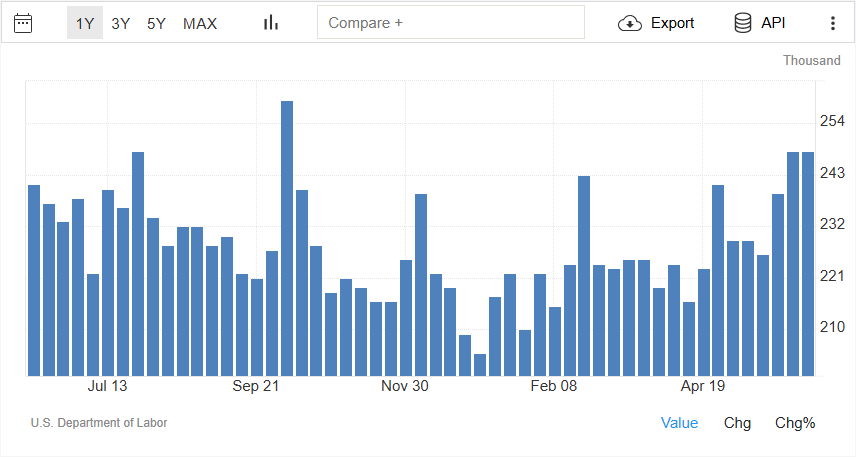
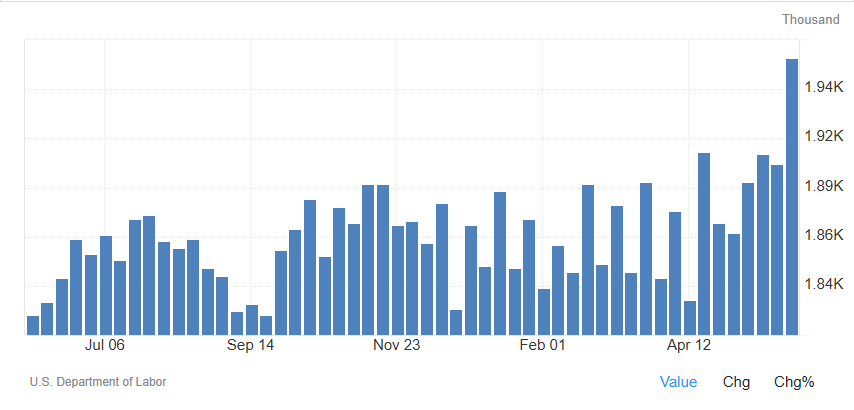 This chart will be the first indicator of a telltale sign that unemployment is increasing. As you see the continuing
jobless claims number rise, it implies the people who lost their jobs are not going back to labor force fast enough
and the unemployment rate is starting to creep higher. Over the last couple of weeks, it has remained roughly flat.
This chart will be the first indicator of a telltale sign that unemployment is increasing. As you see the continuing
jobless claims number rise, it implies the people who lost their jobs are not going back to labor force fast enough
and the unemployment rate is starting to creep higher. Over the last couple of weeks, it has remained roughly flat.
Market Indicators
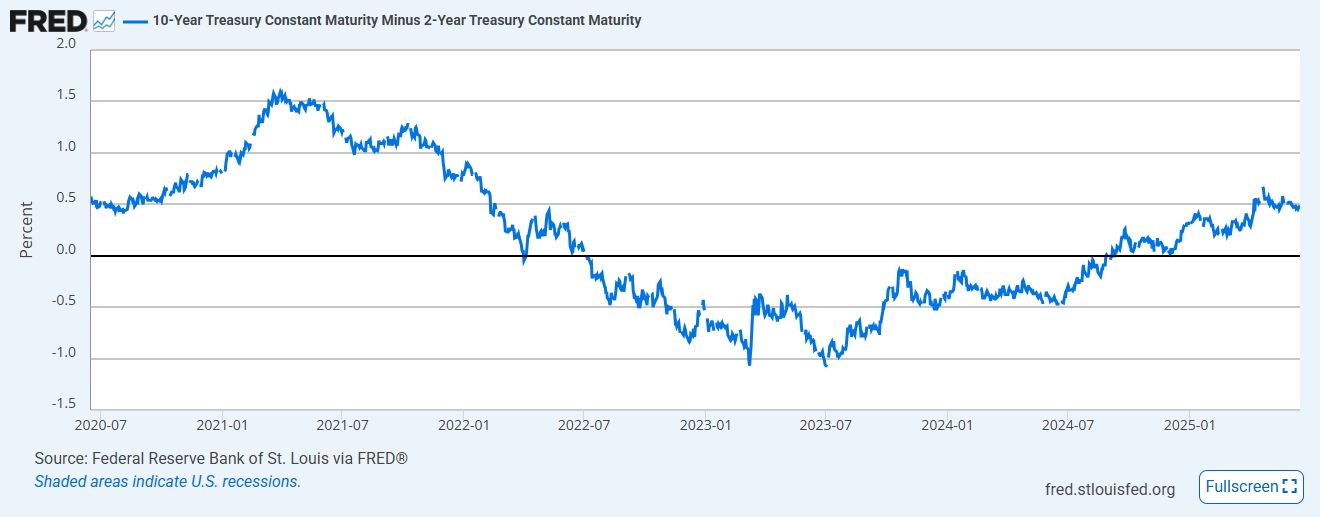
Yield Curve Inversion
Yield Curve - then and now
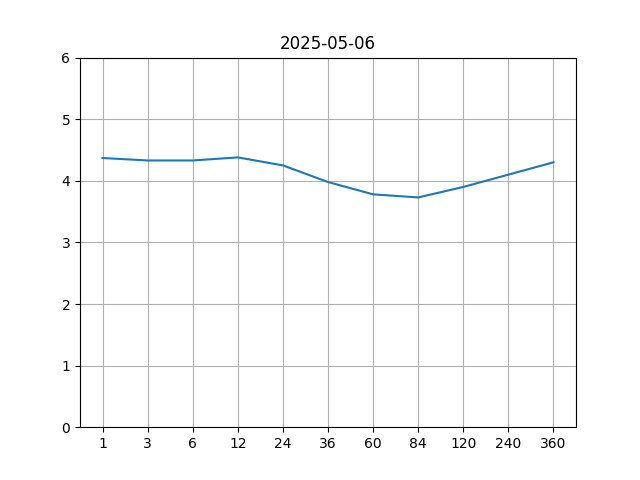 Yield curve - Then
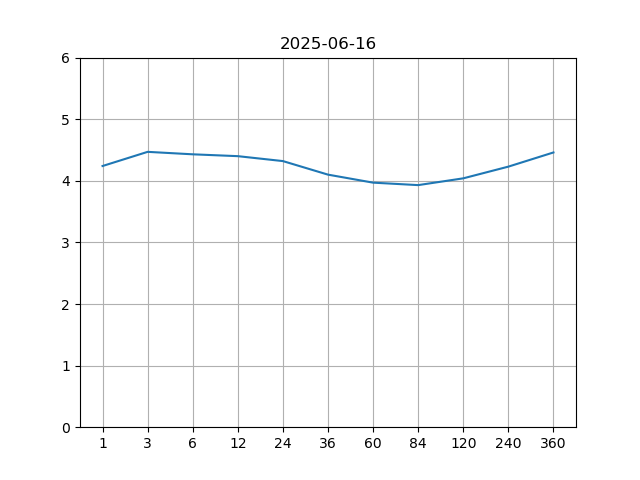 Yield curve - Now
 The yield curve is certainly reverted back to normal. Over the last few weeks, the long end of the rates have edged higher. The FED is likely to keep the short term rates where there are for some more time until the tariff uncertainties are behind us.
Market Sectors
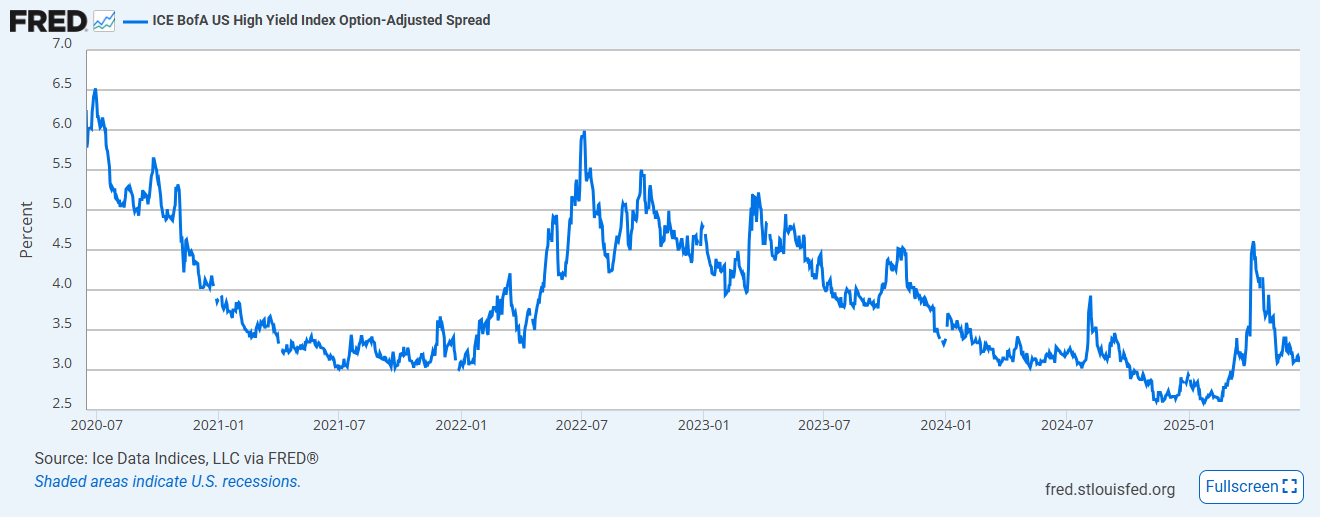
High Yield Index Options-Adjusted Spread
If the economy were to enter a recession, it is likely that some of the companies will struggle to keep up with their debt payments causing their credit spread to widen. This indicator shows how the credit spreads have been behaving well so far even in the face of the Yen carry trade unwind.
The spread is 3.1% currently and sharply rolled over since the April market correction.
Put Call Ratio
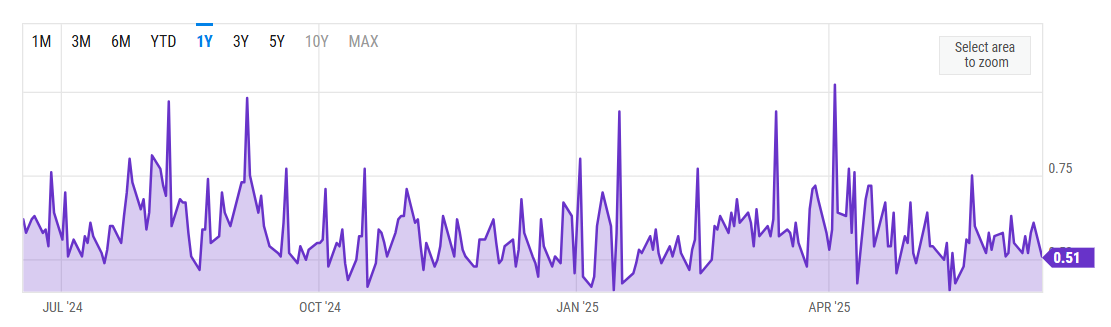
A spike in put / call ratio indicates that investors are very apprehensive about a sudden fall in the equity markets. The last spike seen is around April 2nd, liberation day.
S&P 500 Current Valuations
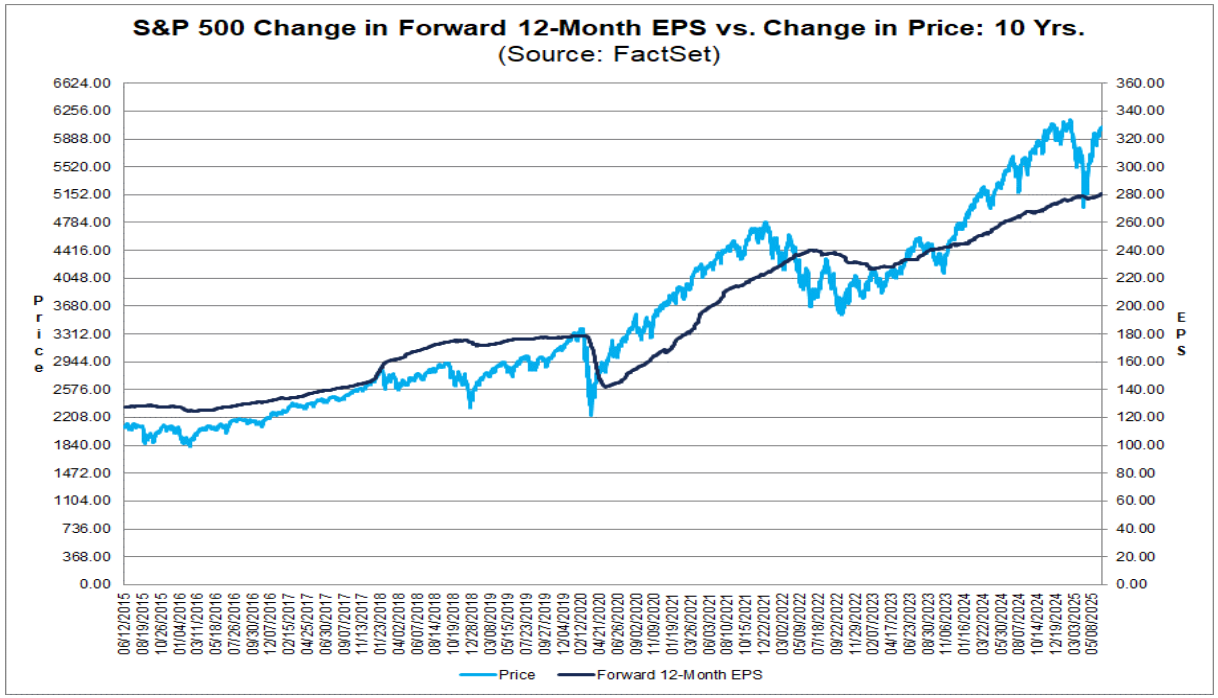
The current earnings forecast by equity analysts estimate the earnings potential for S&P 500 companies to be around $280 which translates to a price to earnings ratio of 21.6 at the current S&P 500 price level. This is above the 5 year and the 10 year averages. After the tariff tantrum, we have seen some forward guidance being pull by some S&P 500 firms. However, the earning growth has continued to be positive.