Macro Economic Update

Comprehensive analysis of 28 key macroeconomic indicators
Published October 04, 2026  ·  Data current as of run date
GDP (QoQ Ann.)+3.7%July 2026
CPI YoY3.7%August 2026
PPI YoY4.6%August 2026
Consumer Sentiment48.1September 2026
ISM Manufacturing54.5Expanding
ISM Services55.4Expanding
Retail Sales MoM+1.14%August 2026
Non-Farm Payrolls+29kSeptember 2026
Unemployment4.2%September 2026
Mortgage Rate 30Y7.28%2026-10-01
Initial Claims197,000K2026-09-26
Yield Curve 10Y-2Y+0.45%Normal
HY OAS Spread3.24%2026-10-01
Put/Call Ratio0.782026-10-04
S&P 500 P/E26.3x2026-10-04

Monthly Macro Commentary — October 2026

Rate Pressures, Energy Spikes, and Midterm Dynamics

The Federal Reserve is widely expected to pause interest rate hikes ahead of November's midterm elections. However, long-end yields have surged, with the 10-year Treasury yield scaling to 5.28%. This sharp rise in long-dated yields is being driven primarily by immense debt issuance to fund AI and hyperscaler infrastructure, alongside a broader market reluctance to hold long-term government debt. Compounding macro headwinds, US diesel prices jumped over 50% in the past month alone, driven by disruptions stemming from the Russia-Ukraine conflict rather than tensions in the Middle East.

On the political front, Kalshi prediction markets currently lean toward a potential Democratic sweep of Congress. Historically, equity markets tend to favor a divided government due to the reduced likelihood of major legislative overhauls. Should political gridlock or legislative clarity emerge post-election, we could see a stabilization in bond yields and a catalyst for a relief rally in equities.

1

Real GDP Growth (GDPNow Estimate)

↗ Source: Federal Reserve Bank of Atlanta
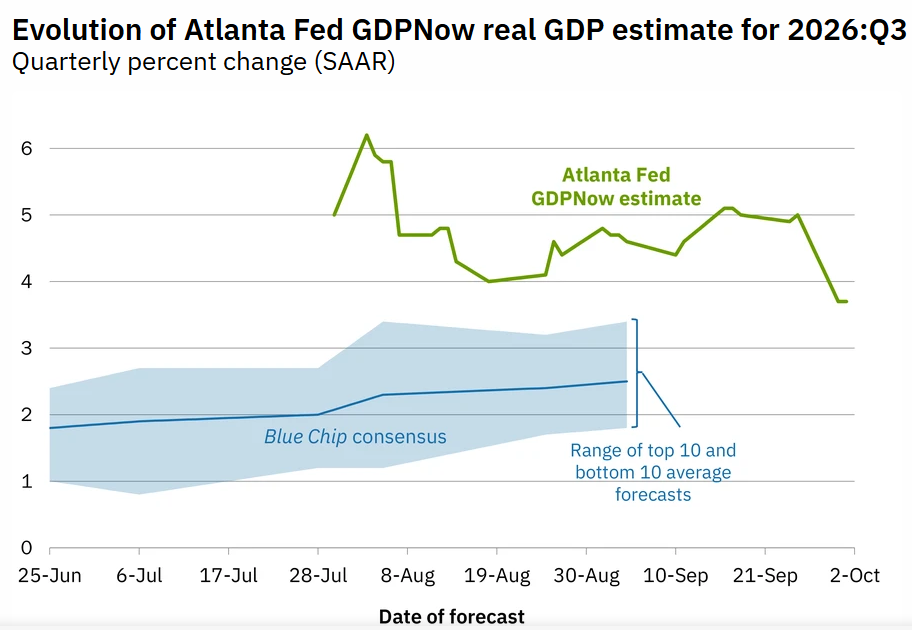
GDP: +3.7% Annualized (GDPNow Current-Quarter Nowcast)
Atlanta Fed GDPNow Chart
Atlanta Fed GDPNow Real-Time GDP Estimate · Source: Atlanta Fed
Real GDP — Annualized Quarter-over-Quarter Change (Nowcast) +3.7% Running current-quarter nowcast · Source: Federal Reserve Bank of Atlanta
PeriodJuly 2026
Bottom Line

GDP growth of +3.7% in July 2026 reflects the current momentum of the US economy.

2

Leading Economic Index (LEI)

↗ Source: The Conference Board / FRED
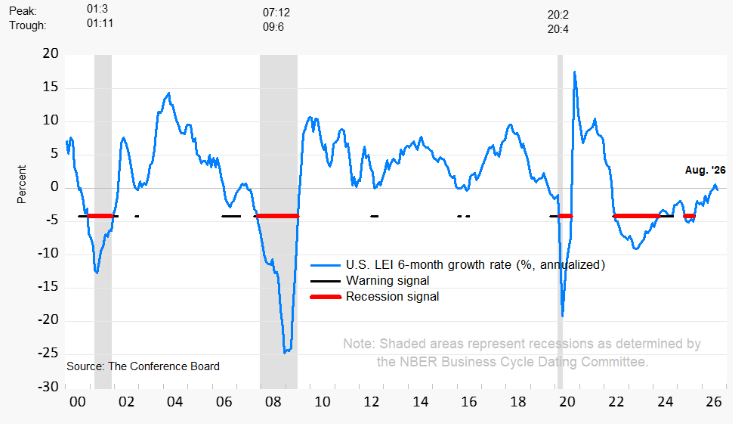
LEI: 149.85 · MoM +0.20%
Conference Board LEI Chart
Conference Board Leading Economic Index · Source: Conference Board
Conference Board LEI — August 2026 149.85 Month-over-Month Change: +0.20%
MoM Change+0.20%
Data PeriodAugust 2026
Bottom Line

The LEI at 149.85 (+0.20% MoM) signals the near-term economic direction. Sustained declines warn of slowdown risk.

3

US Dollar Index (DXY / Trade-Weighted)

↗ Source: Federal Reserve / FRED
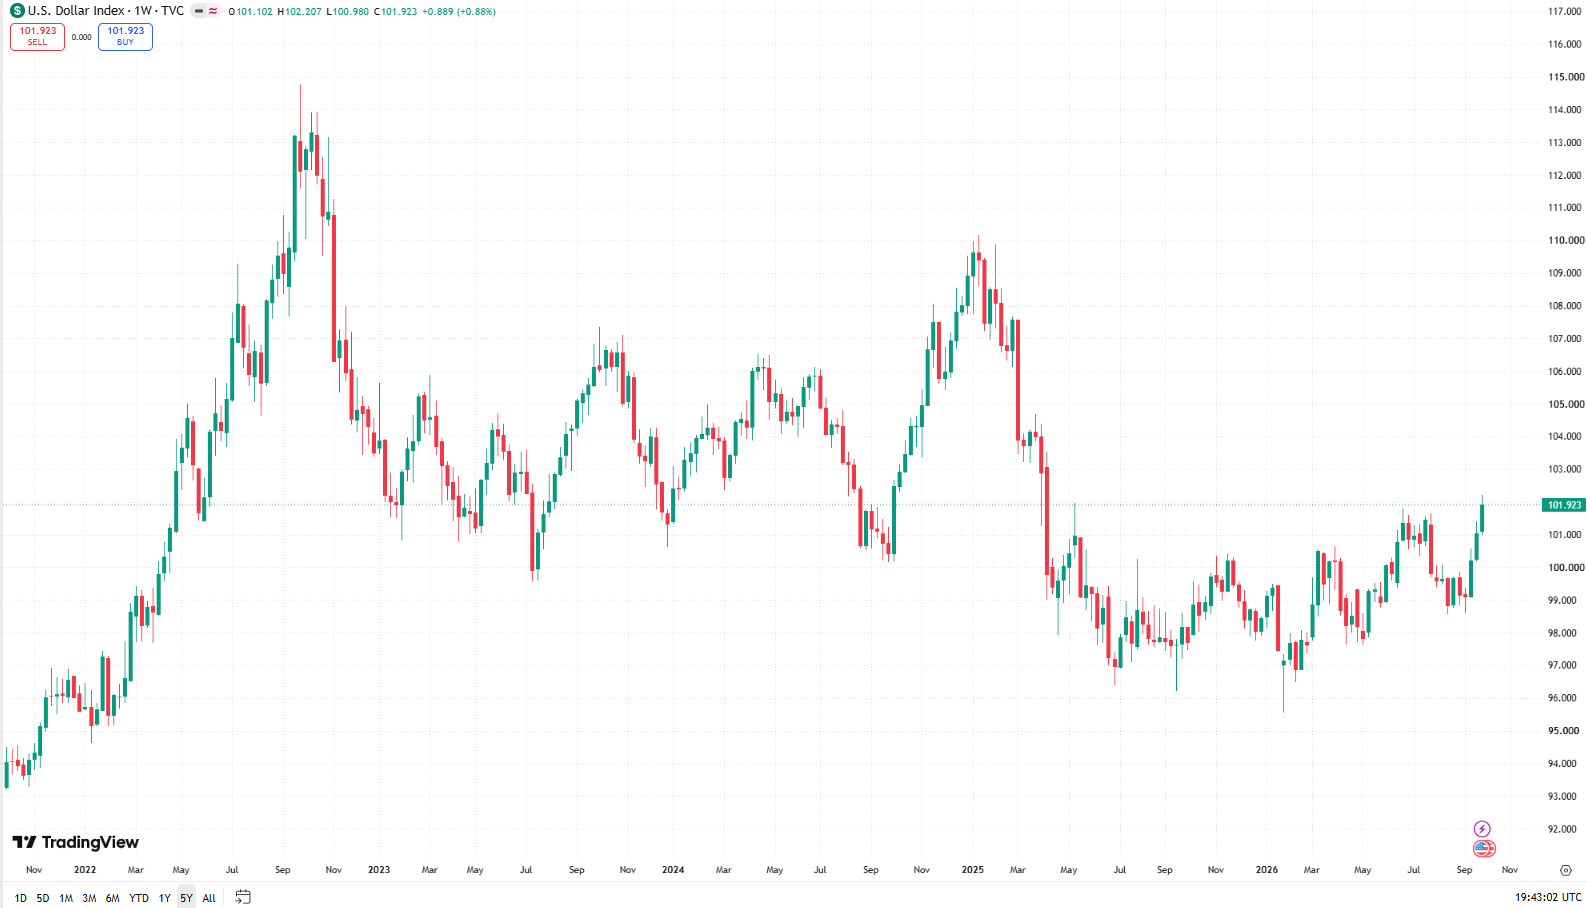
DXY: 101.87 · MoM +2.87% · YoY +4.11%
US Dollar Index Chart
US Dollar Index (DXY) · Source: TradingView / FRED
Broad Trade-Weighted US Dollar Index — 2026-10-04 101.87 YoY: +4.11% · MoM: +2.87%
MoM+2.87%
YoY+4.11%
Date2026-10-04
Bottom Line

The US dollar at 101.87 reflects global demand for dollar assets and influences import prices, commodity markets, and US exports.

4

S&P GSCI Commodity Index

↗ Source: S&P / Yahoo Finance
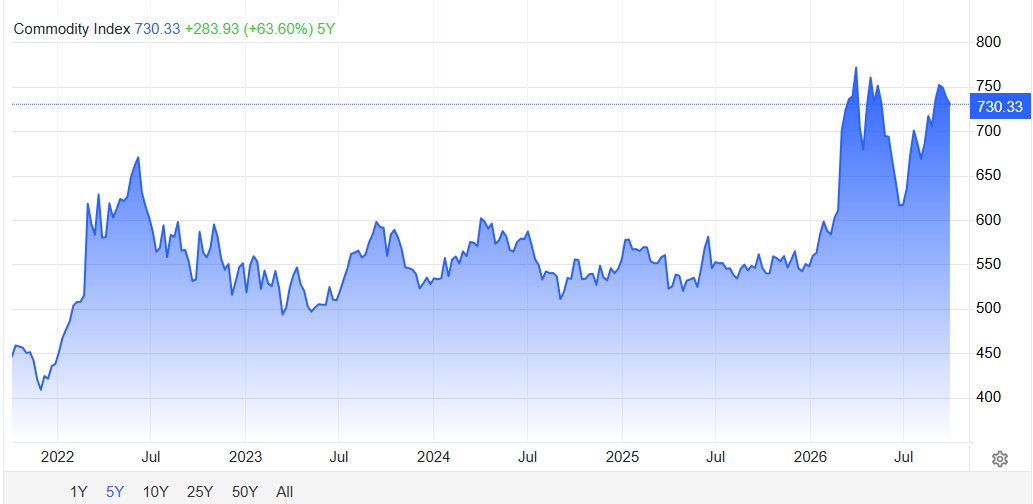
GSCI: 730.33 · As of 2026-10-04
S&P GSCI Commodity Index Chart
S&P GSCI Commodity Index · Source: S&P / Yahoo Finance
S&P GSCI Total Return Index 730.33 Broad commodity basket — energy, metals, agriculture
Date2026-10-04
Bottom Line

Commodity prices as proxied by the GSCI reflect global demand conditions and supply pressures. Rising GSCI feeds into PPI and eventually CPI.

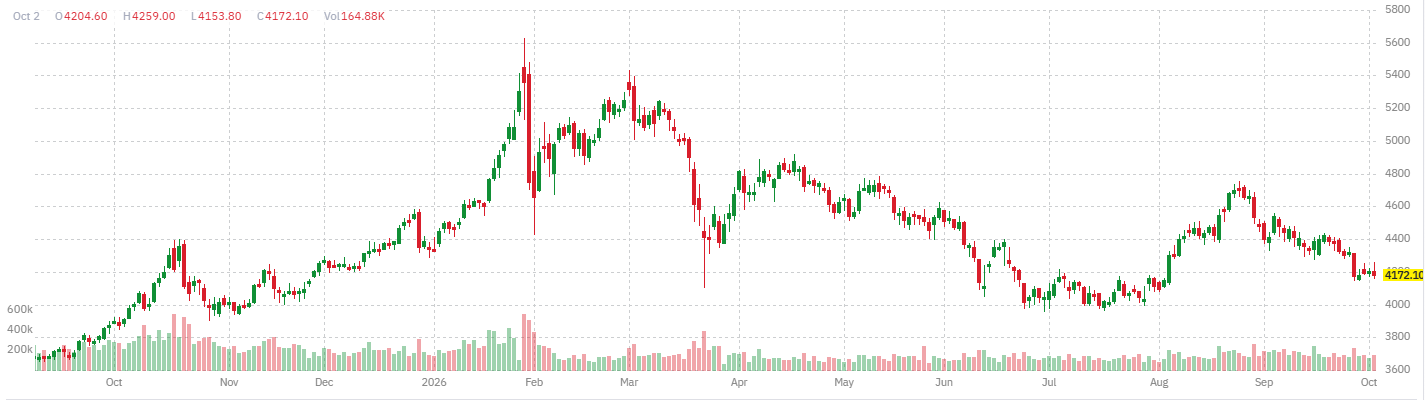
Gold: $4,168 · MoM -8.20% · YoY +22.50%
Gold Futures Chart
Gold Futures (GC) — Price Chart · Source: Finviz
Gold Spot (USD/oz) — 2026-10-04 $4,168 London AM Fixing · YoY: +22.50% · MoM: -8.20%
MoM-8.20%
YoY+22.50%
Bottom Line

Gold at $4,168 reflects safe-haven demand, real interest rate expectations, and dollar strength. Strong YoY gains signal elevated uncertainty.

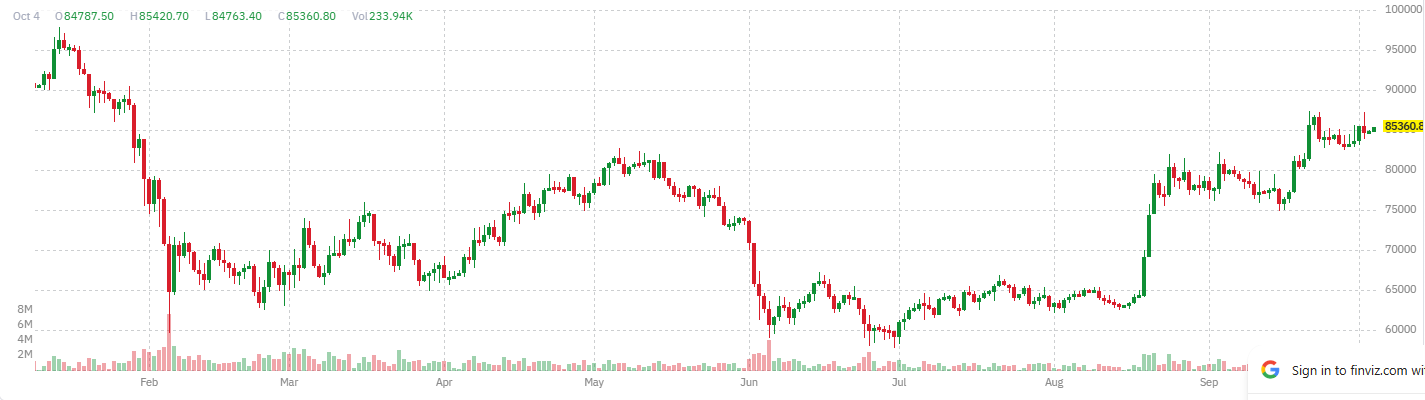
Bitcoin: $86,245 · 7D +1.86% · 30D +8.28%
Bitcoin Price Chart
Bitcoin (BTC/USD) — Price Chart · Source: TradingView
Bitcoin Price (USD) — 2026-10-04 $86,245 7-Day: +1.86% · 30-Day: +8.28%
7-Day Change+1.86%
30-Day Change+8.28%
Bottom Line

Bitcoin at $86,245 serves as a risk sentiment indicator. Its performance relative to gold signals the market's risk appetite.

7

CPI Inflation

↗ Source: BLS / FRED
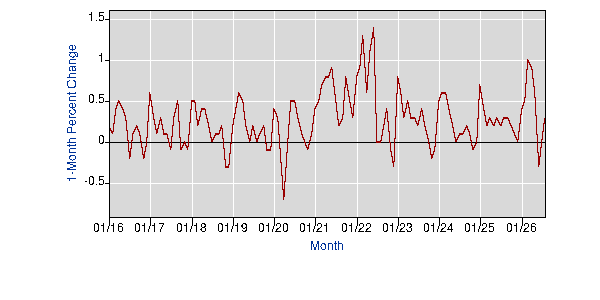
CPI: 3.7% YoY · +0.40% MoM — August 2026
CPI Month-over-Month Chart
CPI Month-over-Month Change · Source: BLS / FRED
CPI All Items — August 2026 3.7% Year-over-Year · MoM: +0.40%
YoY3.7%
MoM+0.40%
PeriodAugust 2026
Bottom Line

CPI at 3.7% YoY in August 2026. The Fed's 2% target remains well above the current inflation rate.

8

PPI Inflation (Producer Prices)

↗ Source: BLS / FRED
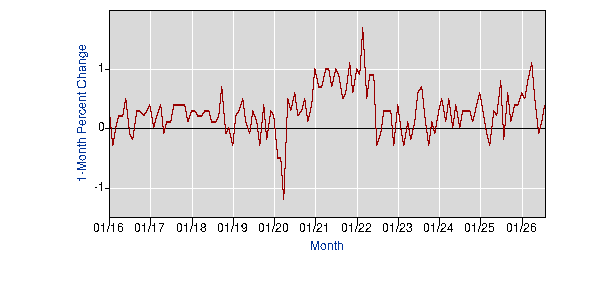
PPI Final Demand: 4.6% YoY · +0.10% MoM — August 2026
PPI Month-over-Month Chart
PPI Month-over-Month Change · Source: BLS / FRED
PPI Final Goods — August 2026 4.6% Year-over-Year · MoM: +0.10%
YoY4.6%
MoM+0.10%
Bottom Line

PPI at 4.6% YoY is a leading indicator of consumer inflation. Rising producer prices typically pass through to CPI within 1–3 months.

9

Consumer Sentiment (UMich)

↗ Source: University of Michigan / FRED
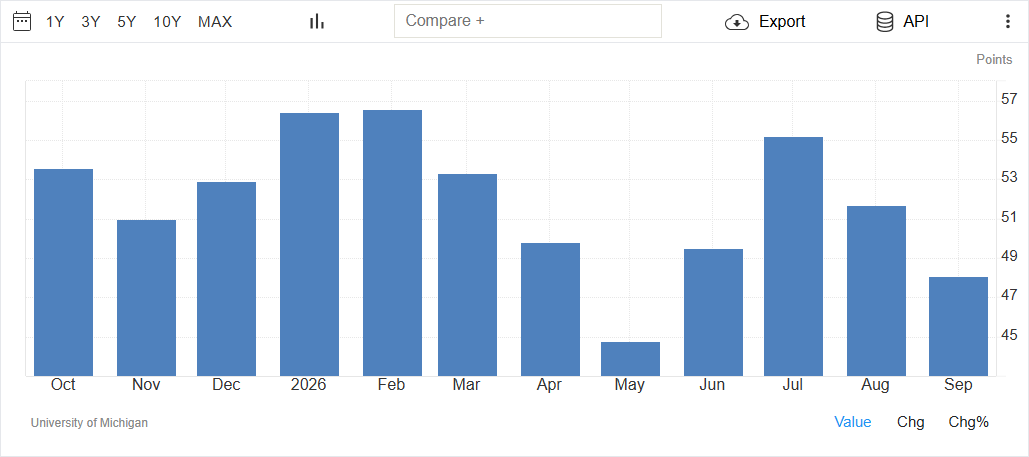
Consumer Sentiment: 48.1 · MoM -3.6 pts — September 2026
Consumer Sentiment Chart
UMich Consumer Sentiment Index · Source: University of Michigan / FRED
UMich Consumer Sentiment — September 2026 48.1 MoM Change: -3.6 pts
MoM Change-3.6 pts
PeriodSeptember 2026
Bottom Line

Consumer sentiment at 48.1 reflects household outlook on finances and the economy. Readings below 70 historically precede spending pullbacks.

10

1-Year Inflation Expectations (UMich)

↗ Source: University of Michigan / FRED
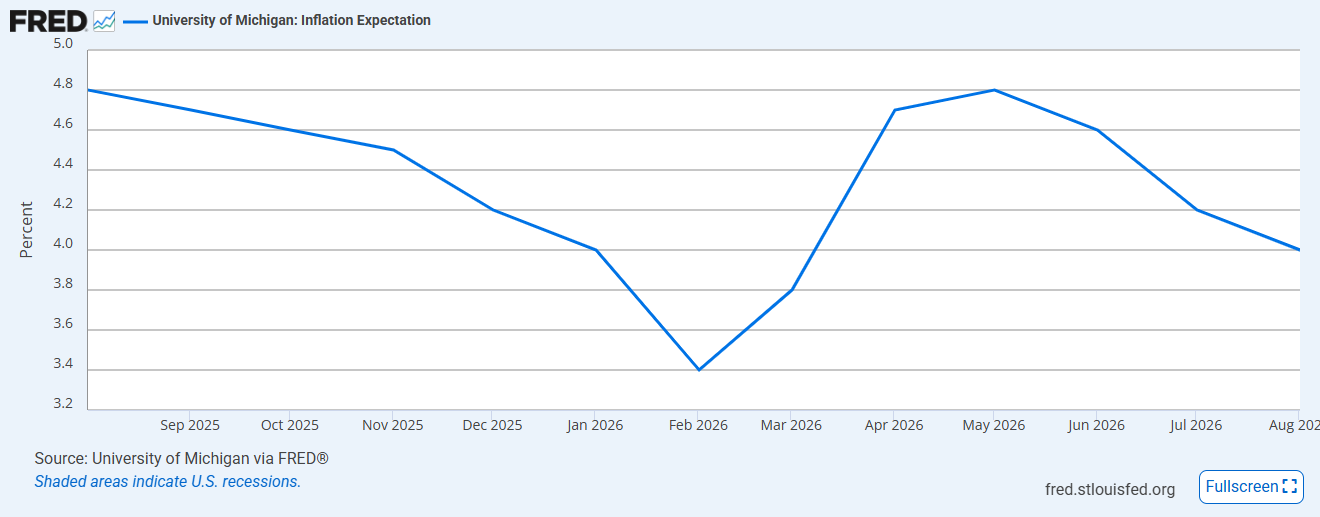
1-Year Inflation Expectations: 4.0% · MoM -0.2%
1-Year Inflation Expectations Chart
1-Year Ahead Inflation Expectations (UMich) · Source: FRED
1-Year Inflation Expectations — August 2026 4.0% Consumer survey · MoM: -0.2%
MoM-0.2%
PeriodAugust 2026
Bottom Line

Inflation expectations at 4.0% matter enormously — the Fed monitors this closely. De-anchoring above 4% historically forces more aggressive policy response.

11

Investor Sentiment (AAII)

↗ Source: AAII
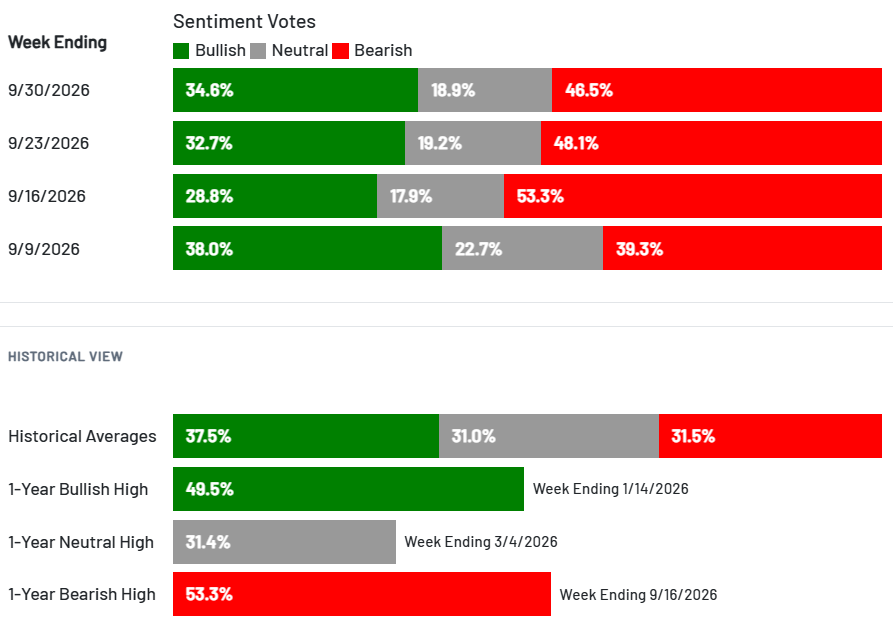
Bullish: 34.6% · Bearish: 46.5% · Neutral: 18.9%
AAII Investor Sentiment Chart
AAII Weekly Investor Sentiment Survey · Source: AAII
AAII Sentiment Survey — Week of 2026-10-04 46.5% Bearish Bullish: 34.6% · Neutral: 18.9%
Bullish34.6%
Bearish46.5%
Neutral18.9%
Bottom Line

AAII sentiment is a contrarian indicator. Extreme bearishness (>50%) historically marks near-term market bottoms; extreme bullishness (>55%) warns of complacency.

12

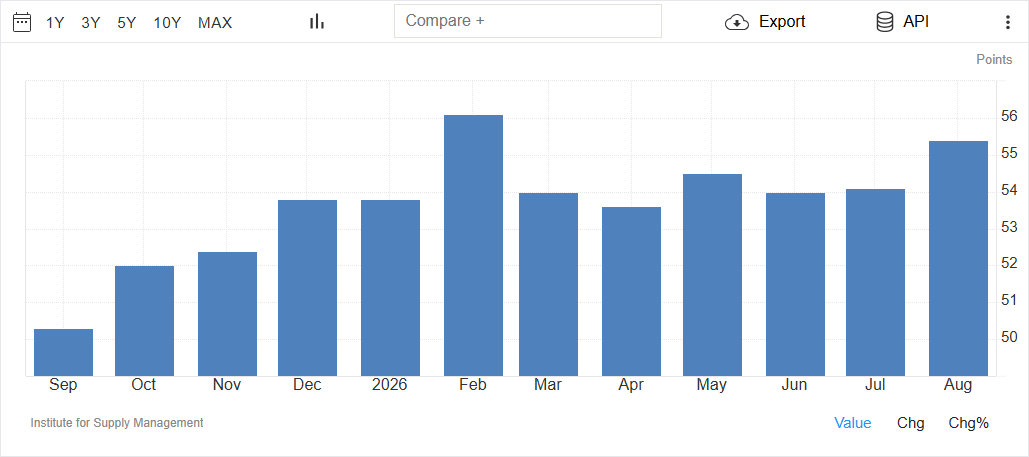
ISM Manufacturing PMI

↗ Source: ISM
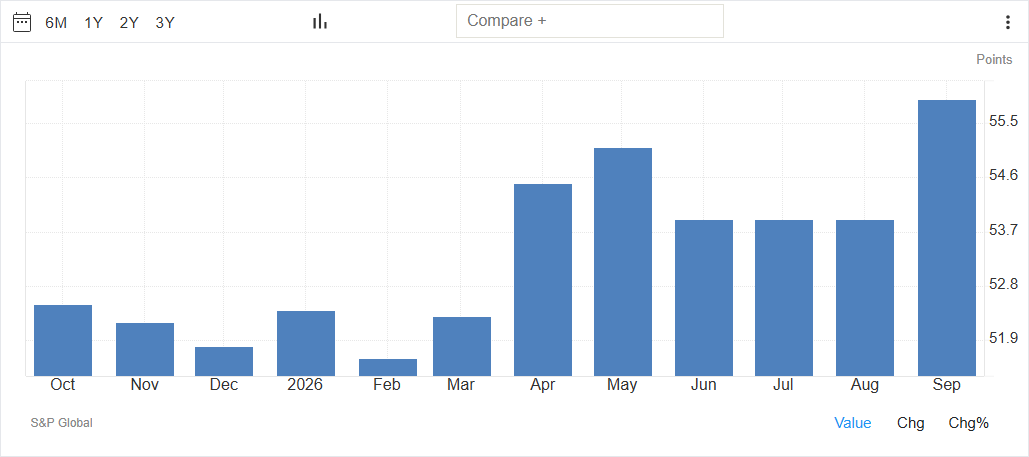
ISM Mfg PMI: 54.5 — Expanding (50 = threshold)
ISM Manufacturing PMI Chart
ISM Manufacturing PMI · Source: ISM
ISM Manufacturing PMI — 2026-10-04 54.5 Above 50 = expansion · Below 50 = contraction
SignalExpanding
Threshold50.0
Bottom Line

Manufacturing PMI of 54.5 indicates the factory sector is in expansion. Manufacturing has outsized influence on employment and capital expenditure cycles.

13

ISM Services PMI

↗ Source: ISM
ISM Services PMI: 55.4 — Expanding
ISM Services PMI Chart
ISM Services PMI · Source: ISM
ISM Services PMI — 2026-10-04 55.4 Services represent ~80% of US GDP
SignalExpanding
Bottom Line

Services PMI at 55.4 covers the dominant segment of the US economy. Sustained readings below 50 signal broad economic contraction.

14

Industrial Production Index

↗ Source: Federal Reserve / FRED
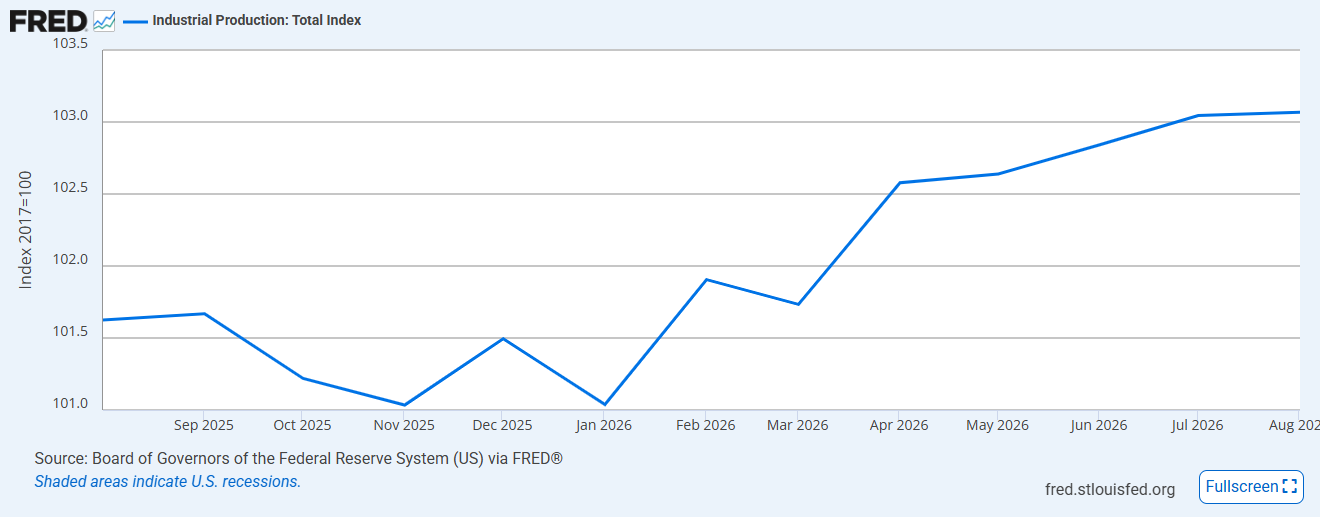
Industrial Production: 103.07 · MoM +0.02% · YoY +1.42%
Industrial Production Chart
Industrial Production Index (INDPRO) · Source: Federal Reserve / FRED
Industrial Production Index — August 2026 +0.02% MoM change · Index level: 103.07 · YoY: +1.42%
MoM+0.02%
YoY+1.42%
Bottom Line

Industrial production at 103.07 (+0.02% MoM) reflects the health of manufacturing, mining, and utilities. A key real-economy gauge alongside ISM surveys.

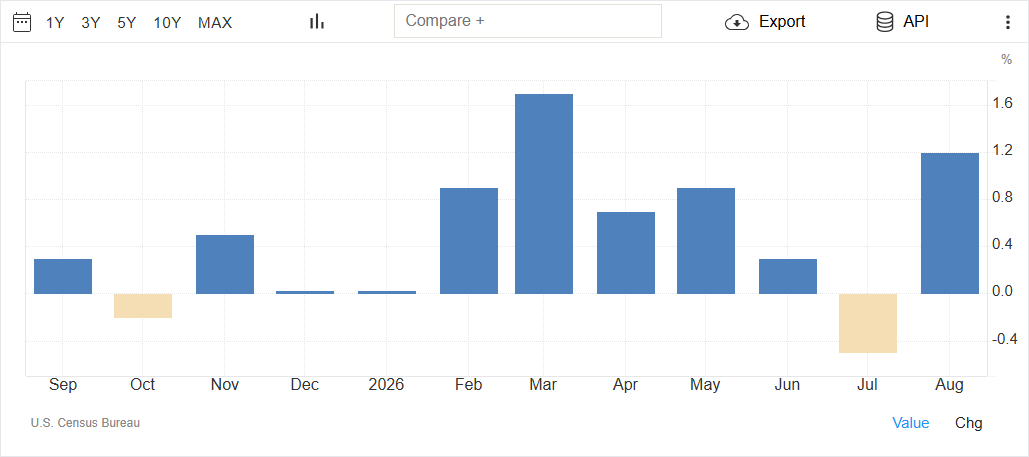
Retail Sales: +1.14% MoM · +5.36% YoY — August 2026
Retail Sales Chart
Advance Retail Sales (excl. food services) · Source: US Census / FRED
Retail & Food Service Sales — August 2026 +1.14% Month-over-Month · YoY: +5.36%
MoM+1.14%
YoY+5.36%
Bottom Line

Retail sales +1.14% MoM in August 2026 reflect the consumer's willingness to spend. Consumer spending drives ~70% of US GDP — retail trends are the economy's pulse.

16

Non-Farm Payrolls

↗ Source: BLS / FRED
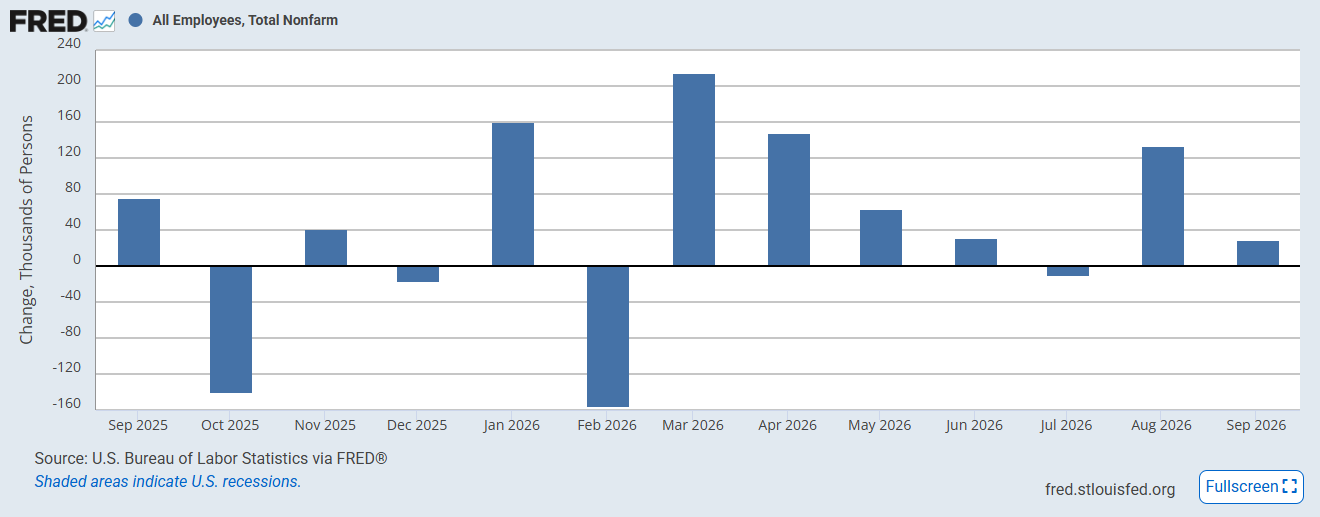
NFP: +29k Jobs Added — September 2026
Non-Farm Payrolls Chart
Monthly Non-Farm Payrolls Change · Source: BLS / FRED
Non-Farm Payrolls Change — September 2026 +29k Prior Month: +133k
This Month+29k
Prior Month+133k
Bottom Line

Payrolls of +29k in September 2026. Sustained prints below 100k/month signal labor market deterioration; above 200k signals robust demand for workers.

17

Total Vehicle Sales

↗ Source: BEA / FRED
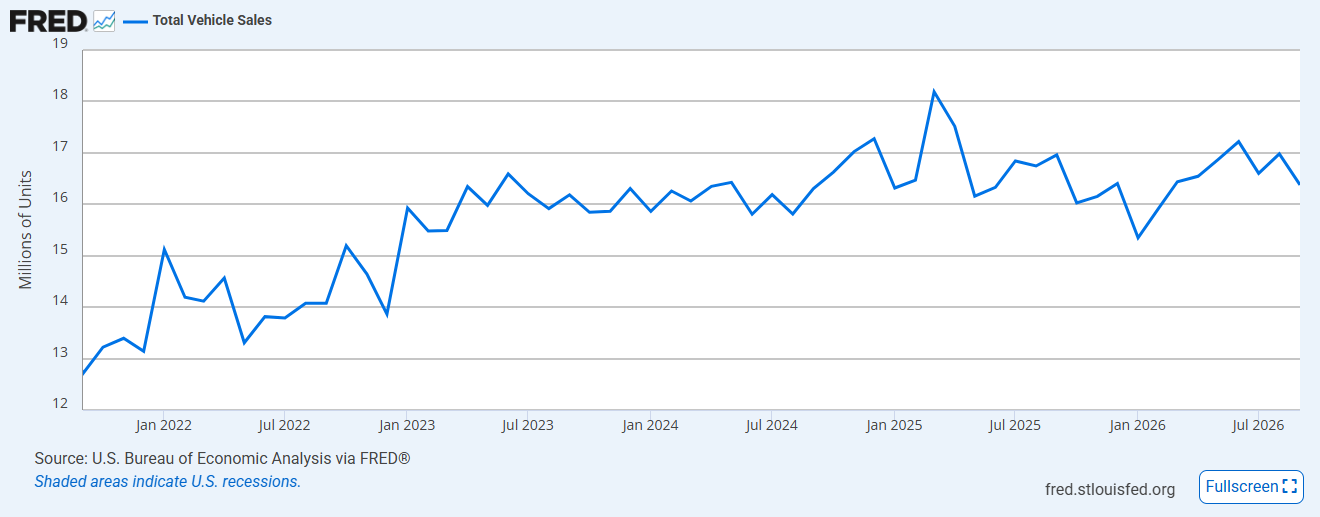
Vehicle Sales: 16.38M SAAR — September 2026
Total Vehicle Sales Chart
Total Vehicle Sales SAAR (Millions) · Source: BEA / FRED
Total Light Vehicle Sales SAAR — September 2026 16.38M SAAR MoM change: -0.60M million units
SAAR Level16.38M SAAR
MoM Change-0.60M
Bottom Line

Vehicle sales at 16.38M SAAR are a discretionary spending bellwether. Pre-pandemic average was ~17M SAAR — levels significantly below that indicate consumer caution.

18

Manheim Used Vehicle Value Index

↗ Source: Manheim / Cox Automotive
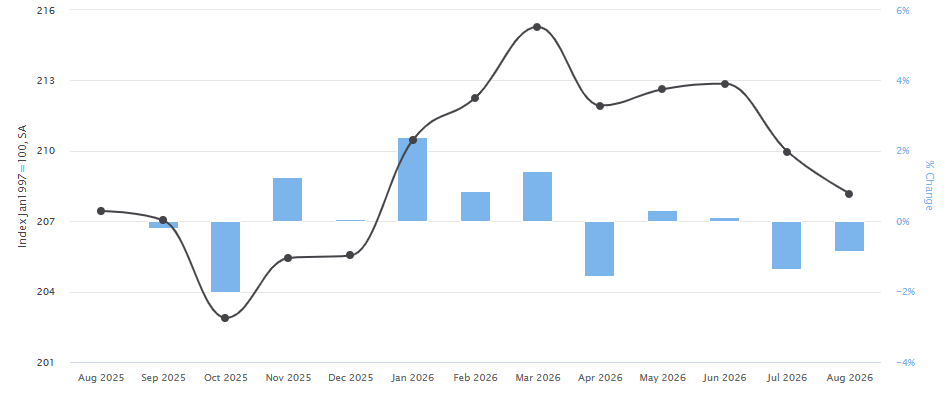
Manheim Index: 208.20 · MoM -0.90%
Manheim Used Car Index Chart
Manheim Used Vehicle Value Index · Source: Cox Automotive / Manheim
Manheim Used Vehicle Value Index — 2026-10-04 208.20 MoM: -0.90% (seasonally adjusted)
MoM-0.90%
Bottom Line

The Manheim index at 208.20 is a leading indicator for used-car CPI. Rising used car prices add directly to core CPI with a 1–2 month lag.

19

New Home Sales Monthly Supply

↗ Source: US Census Bureau / FRED
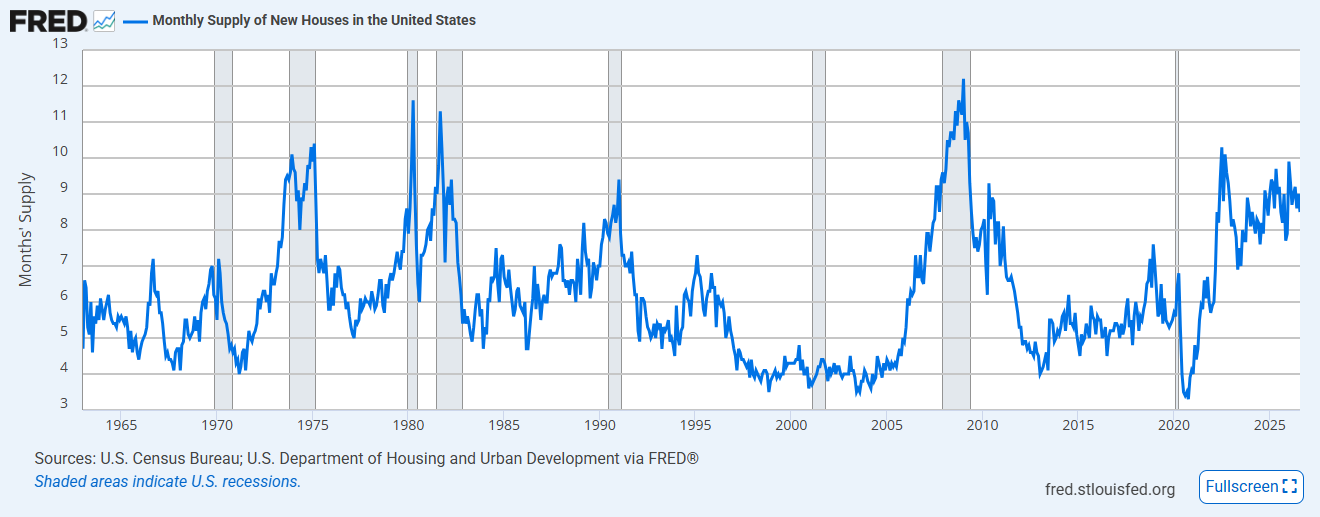
New Home Supply: 8.5 months — August 2026 (5–6 months = balanced)
New Home Sales Monthly Supply Chart
Monthly Supply of New Houses in the US · Source: US Census Bureau / FRED
Monthly Supply of New Houses — August 2026 8.5 months Months of supply at current sales pace · Balanced = 5–6 months
PeriodAugust 2026
Balanced Level5–6 months
Bottom Line

New home supply at 8.5 months signals a buyer's market with excess inventory. Sustained oversupply puts downward pressure on new home prices.

20

30-Year Fixed Mortgage Rate

↗ Source: Freddie Mac / FRED
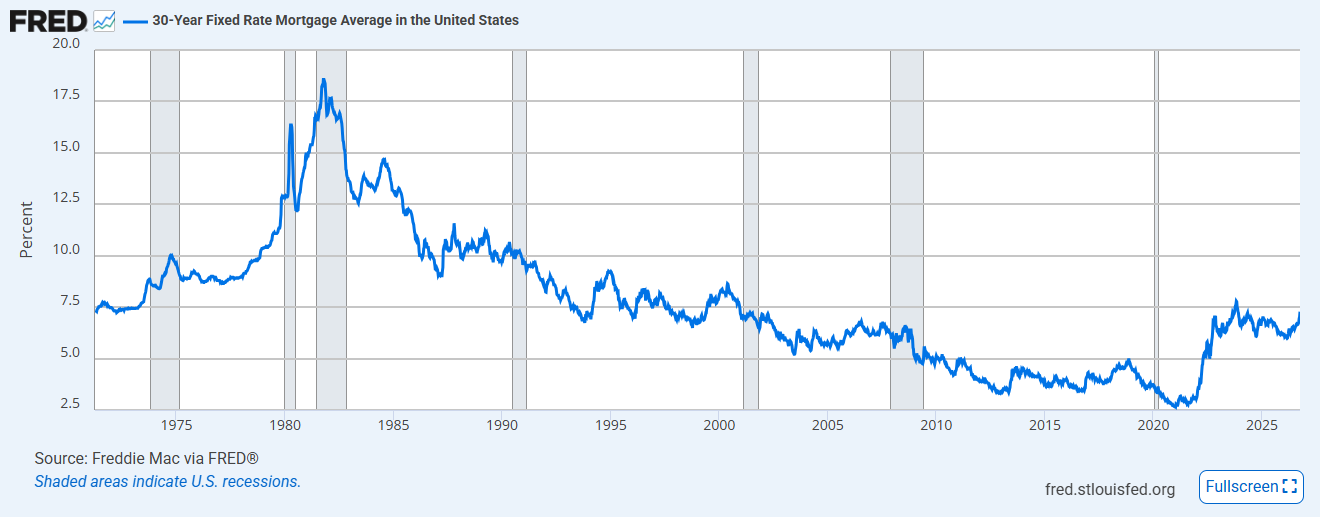
30-Year Rate: 7.28% · WoW +0.25% — 2026-10-01
30-Year Fixed Mortgage Rate Chart
30-Year Fixed Mortgage Rate (MORTGAGE30US) — Freddie Mac Weekly Survey · Source: FRED
30-Year Fixed Mortgage Rate — Week of 2026-10-01 7.28% Freddie Mac Primary Mortgage Market Survey · WoW: +0.25%
WoW Change+0.25%
Survey Date2026-10-01
Affordable Level< 5.5%
Bottom Line

Mortgage rates at 7.28% remain at historically restrictive levels. Meaningful housing recovery requires rates well below 6%.

21

Unemployment Rate

↗ Source: BLS / FRED
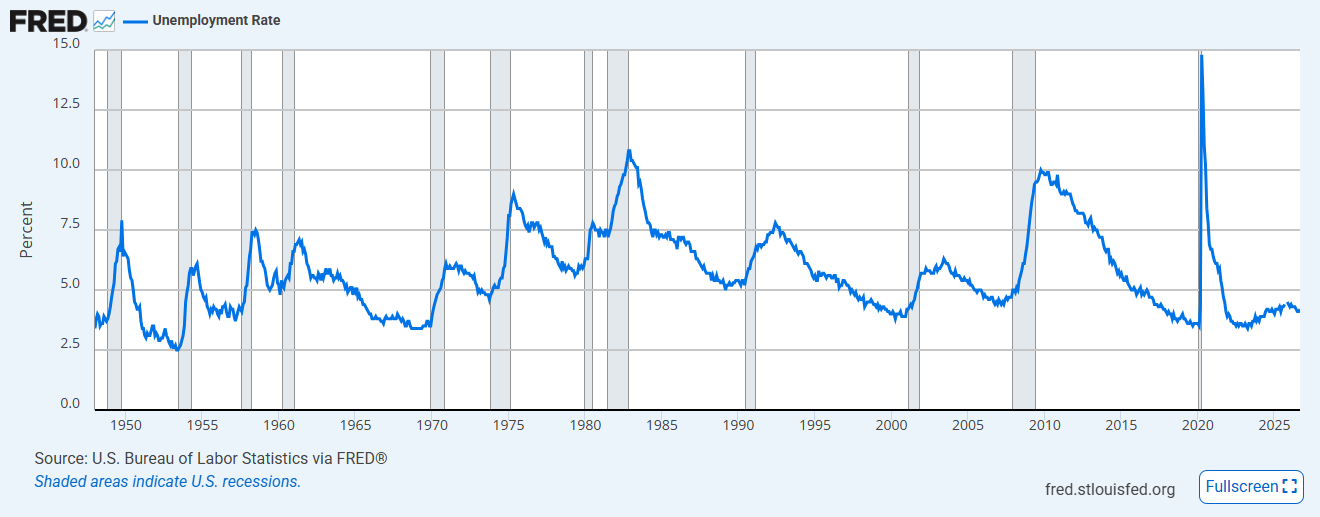
Unemployment: 4.2% · MoM +0.1pp — September 2026
US Unemployment Rate Chart
US Unemployment Rate (UNRATE) — Seasonally Adjusted · Source: BLS / FRED
Unemployment Rate — September 2026 4.2% Seasonally Adjusted · MoM: +0.1pp
MoM Change+0.1pp
PeriodSeptember 2026
Recession Signal> 4.5%
Bottom Line

Unemployment at 4.2% is softening gradually. A move above 4.5% would significantly raise recession risk assessments.

22

Jobless Claims

↗ Source: DOL / FRED
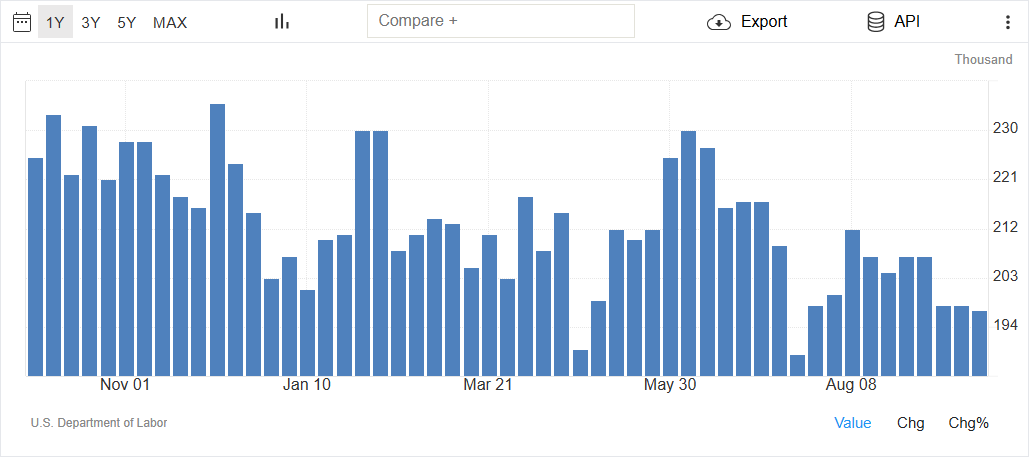
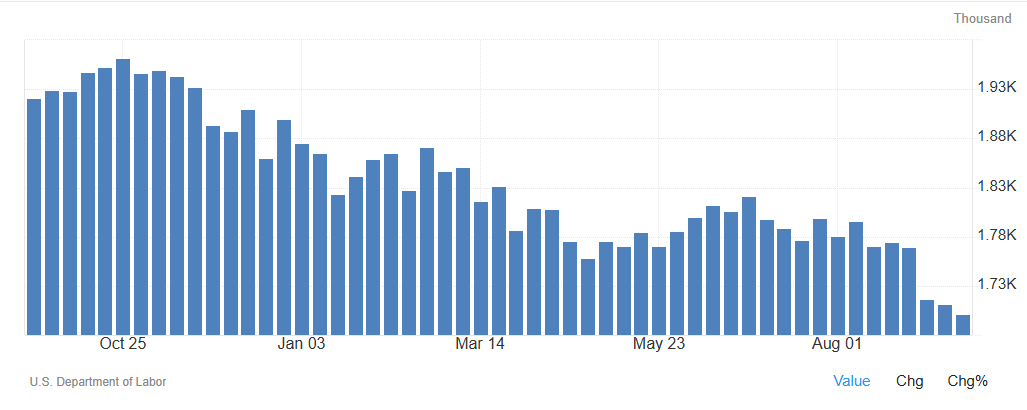
Initial Claims: 197,000K (-1,000K WoW) · Continuing: 1,701,000K
Initial Jobless Claims Chart
Initial Jobless Claims (Weekly) · Source: DOL / FRED
Continuing Claims Chart
Continuing Claims (Insured Unemployment) · Source: DOL / FRED
Initial Jobless Claims — Week of 2026-09-26 197,000K WoW change: -1,000K · Continuing Claims: 1,701,000K
Initial (wk 2026-09-26)197,000K
WoW Change-1,000K
Continuing (2026-09-19)1,701,000K
Alert Threshold> 260K
Bottom Line

Initial claims of 197,000K and continuing claims of 1,701,000K. Watch for sustained initial claims above 260k as the threshold for labor market deterioration.

23

Yield Curve (10Y–2Y Spread)

↗ Source: US Treasury / FRED
10Y–2Y Spread: +0.45% · Un-inverted — Normalizing
10-Year minus 2-Year Treasury Yield — 2026-10-02 +0.45% MoM change: +0.05pp · Recession signal: sustained inversion
Spread+0.45%
StatusNormal
MoM Change+0.05pp
Bottom Line

The yield curve has un-inverted to +0.45% — normalizing from prolonged inversion. Watch whether steepening accelerates.

24

High Yield OAS Spread

↗ Source: ICE BofA / FRED
HY OAS: 3.24% · MoM +0.58pp
ICE BofA US HY OAS Spread — 2026-10-01 3.24% MoM: +0.58pp · Crisis threshold: >8%
OAS Spread3.24%
MoM Change+0.58pp
YoY Change
Crisis Level> 8%
Bottom Line

HY OAS at 3.24% indicates calm credit markets with tight spreads — risk appetite is healthy. Spreads above 8% historically signal systemic stress.

25

Put/Call Ratio

↗ Source: CBOE
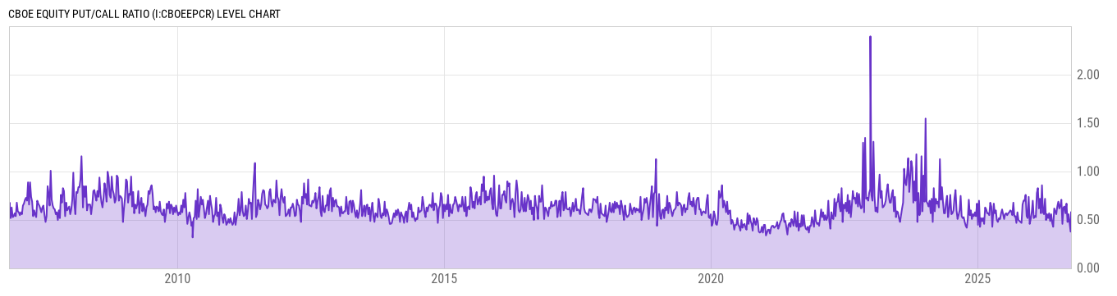
Put/Call Ratio: 0.78 — Fearful / Hedging
CBOE Put/Call Ratio Chart
CBOE Total Put/Call Ratio · Source: CBOE
CBOE Total Put/Call Ratio — 2026-10-04 0.78 Below 0.7 = bullish · Above 1.0 = fear · Contrarian indicator
Ratio0.78
SignalCautious
Bottom Line

Put/Call ratio at 0.78. As a contrarian indicator: extreme fear (ratio >1.2) often marks near-term bottoms, while complacency (ratio <0.5) can precede corrections.

26

S&P 500 Valuation & Earnings

↗ Source: multpl.com / FactSet
S&P 500 P/E: 26.3x — Stretched Valuation
S&P 500 EPS Chart
S&P 500 Earnings Per Share (EPS) · Source: FactSet
S&P 500 Price/Earnings Ratio — 2026-10-04 26.3x Historical average ~17x · Elevated = >22x
P/E Ratio26.3x
Hist. Avg~17x
Date2026-10-04
Bottom Line

S&P 500 trading at 26.3x. Elevated P/E ratios reduce the margin of safety and make equities more vulnerable to earnings disappointments or rate shocks.

Macro Economic Update — October 2026

Generated October 04, 2026 · Data sourced from FRED, BLS, ISM, AAII, CBOE, Manheim, and CoinGecko.
This report is for informational purposes only and does not constitute investment advice.