Economic Updates for October 2023
Summary
Cautious Optimism Amidst Rising Long-Term Yields and Economic Signals
The main highlight of this month has been the noticeable increase in long-term yield curve rates, which have surged by approximately 50 basis points in recent weeks.
This surge seems to be primarily driven by technical factors, stemming from an oversupply of new Treasury issuances without a corresponding increase in demand. The Federal Reserve (FED), a consistent buyer in the market, is currently engaged in Quantitative Tightening (QT), which has not been supportive of demand. On the positive side, factors like Purchasing Managers' Index (PMI) indicators stabilizing, economic growth showing signs of strength, and the yield curve un-inverting all suggest the beginnings of a gentle economic recovery. Conversely, negative factors include mounting U.S. debt, the potential for a government shutdown, and waning foreign interest in U.S. Treasuries.
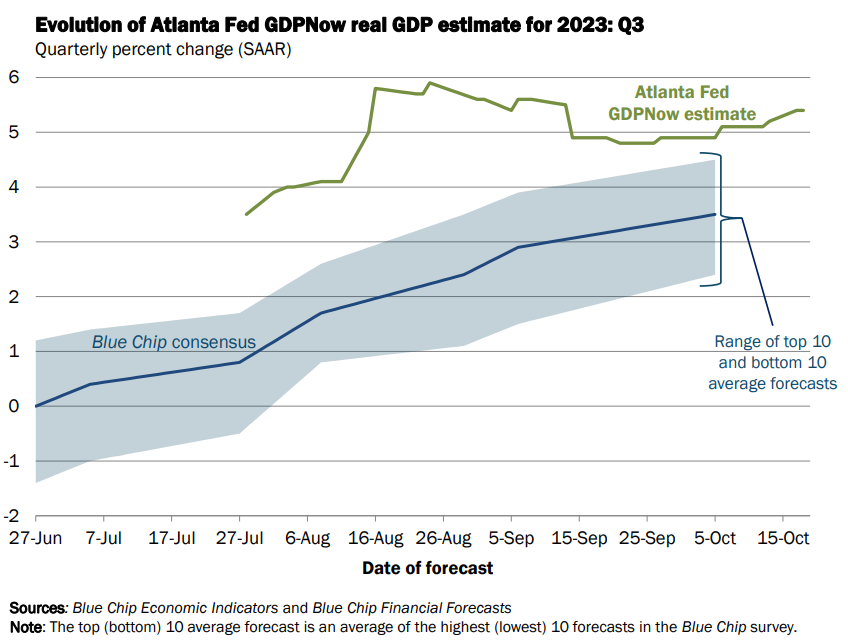
Upon examining concrete economic data, there's reason for optimism regarding an upturn in growth. Q3 earnings calls commenced last week, and there are indications that earnings may pick up. Another source of optimism for the coming week is to observe whether the Federal Reserve maintains its current pause, as the 10-year Treasury yield has already made significant movements doing the Federal Reserve's work.
While the stock market experienced a decline last week, if indeed growth is picking up, it is possible that this represents the worst of it, at least for the next several months.
Broad Indicators
Atlanta GDP NowCast
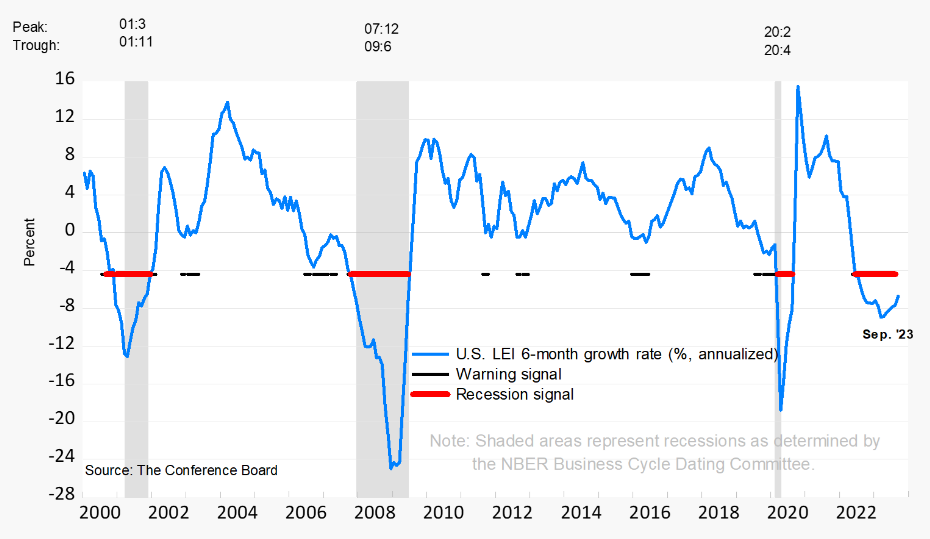
Conference Board's Leading Economic Indicator
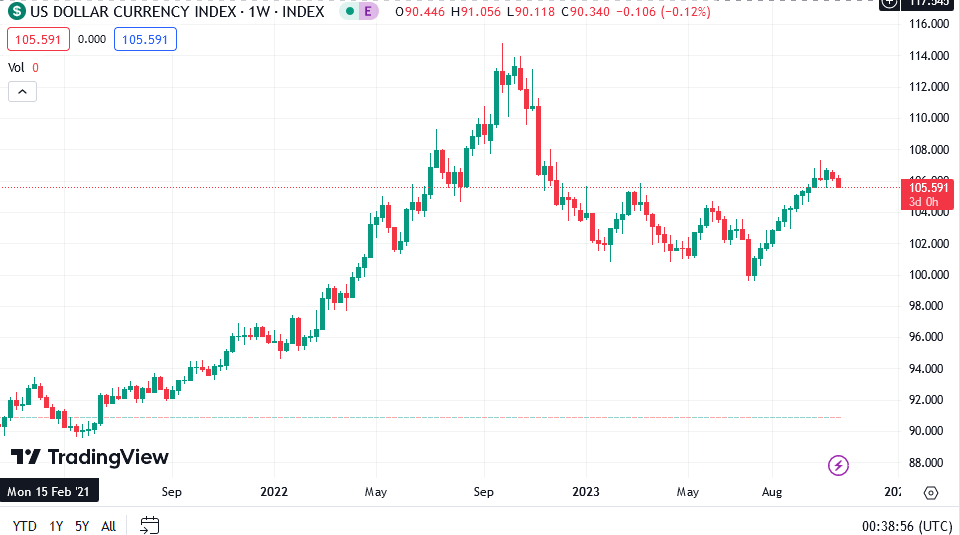
US Dollar Index
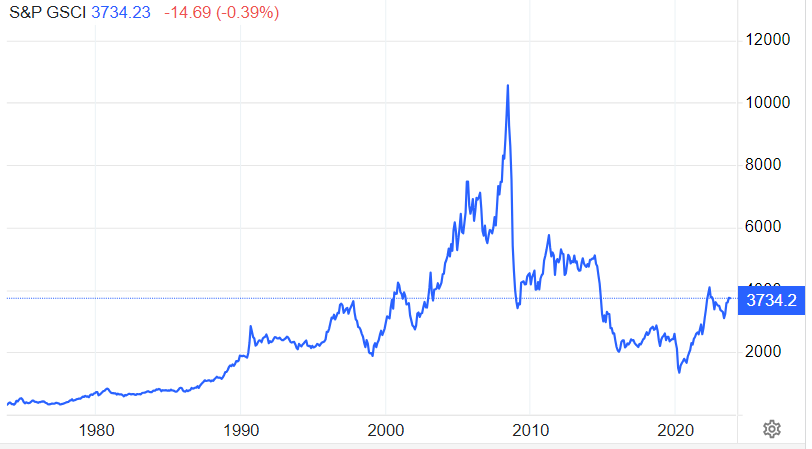
Commodities
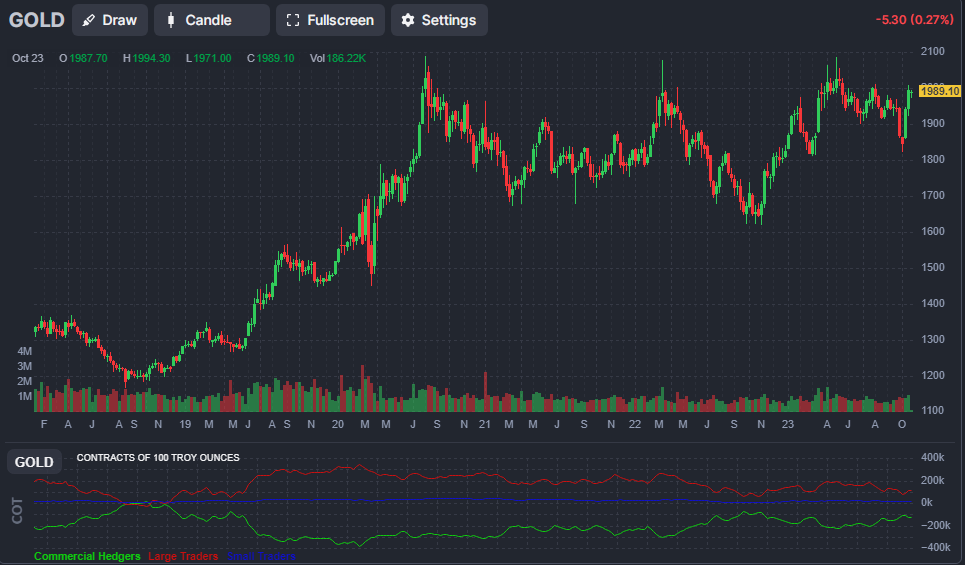
Gold
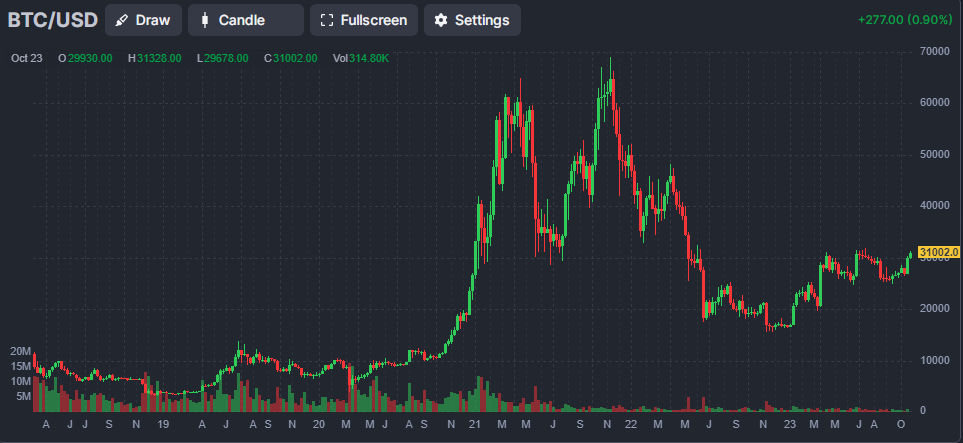
BitCoin
Inflation
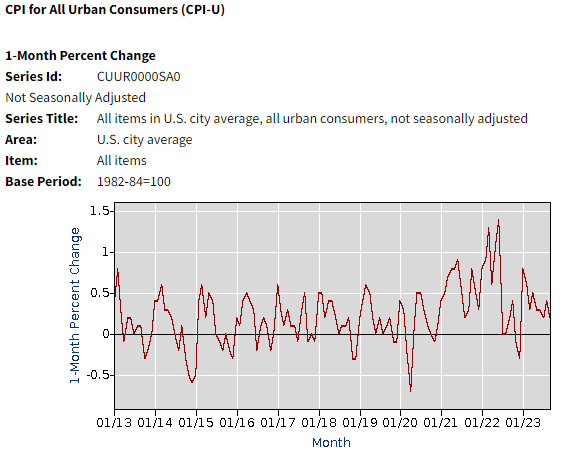
CPI Month over Month
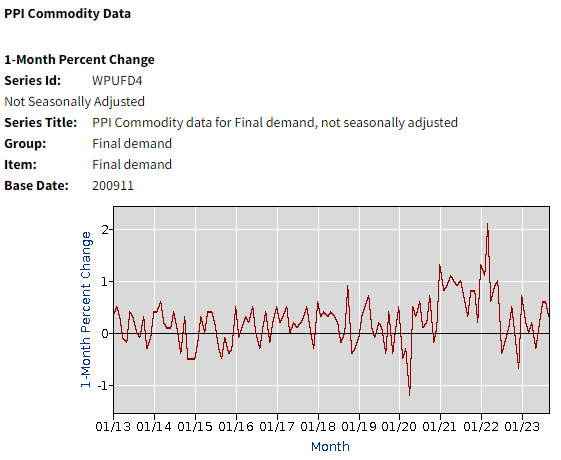
PPI Month over Month
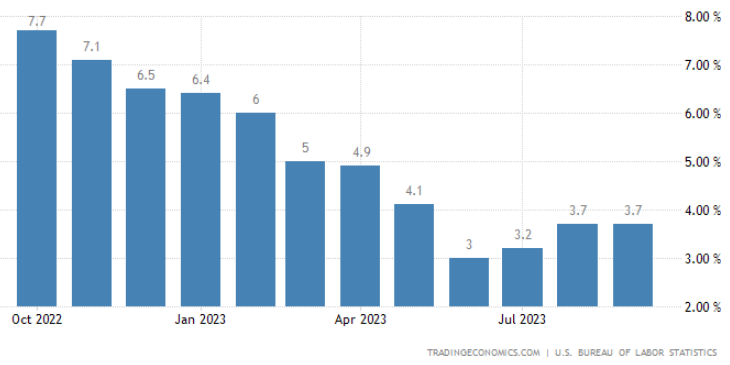
Reported Year over Year Inflation Rate
CPI Components
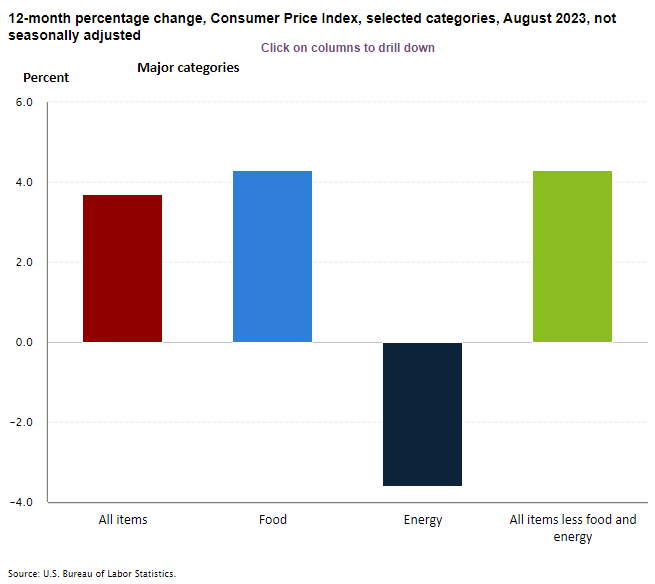 CPI Components Last Month
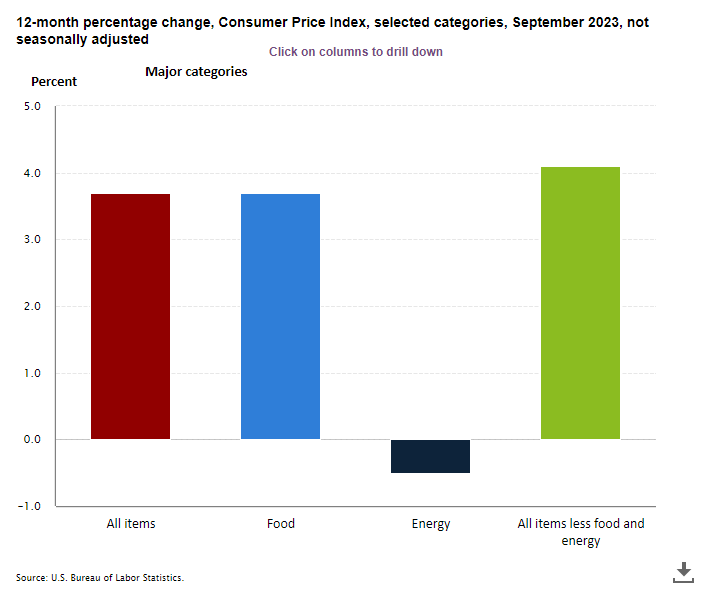 CPI Components This Month
Energy prices have risen in the last month. You can see that as energy's contribution to reducing inflation is coming down - it is a double negative. (Please note that the y-axis in both the graphs have different scales).
One Year Inflation Expectations
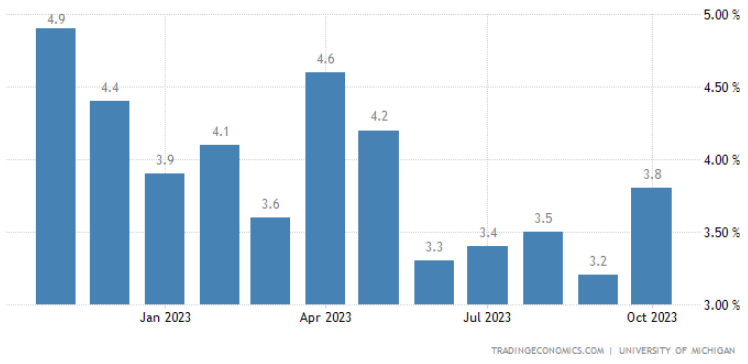
Sentiments
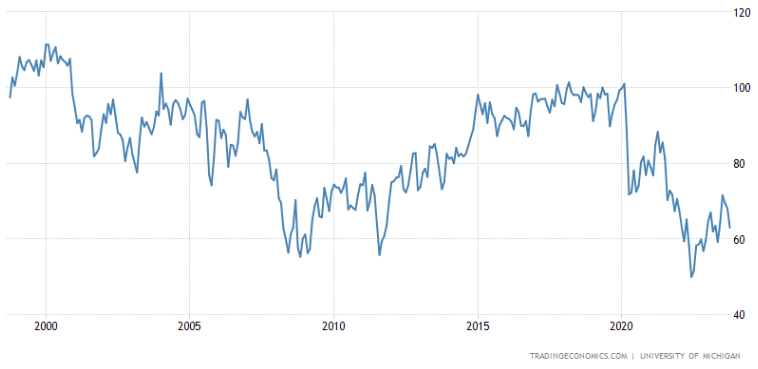
Consumer Sentiments
Investor Sentiments
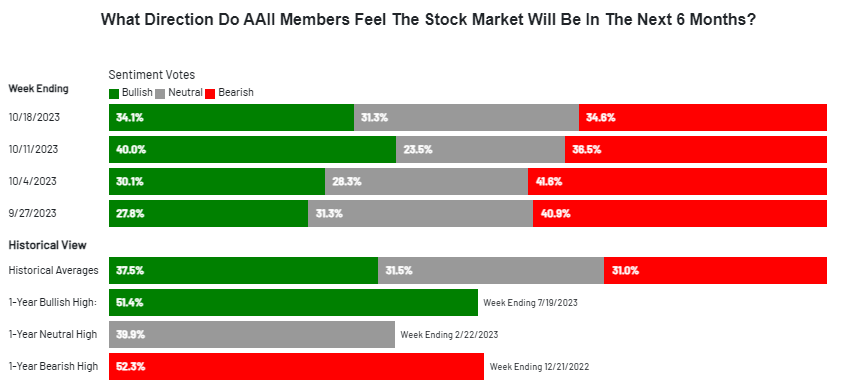
The AAII sentiment has been moderating as the S&P 500 has been rolling over in the past few weeks.
FED's higher for longer narrative as well as tension in the middle east are pressuring stocks at the moment.
GDP Factors
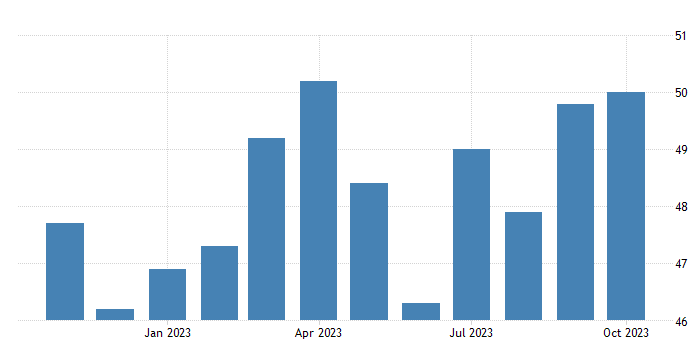
Manufacturing PMI
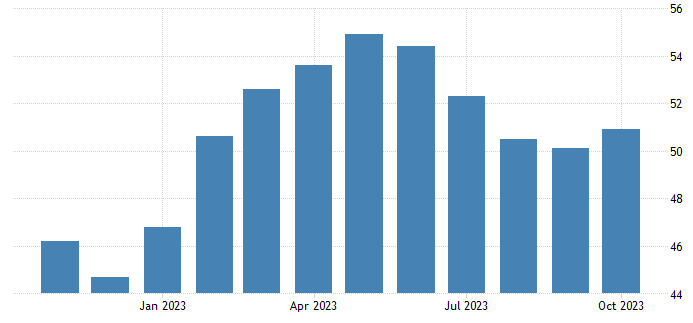
Services PMI
Industrial Production
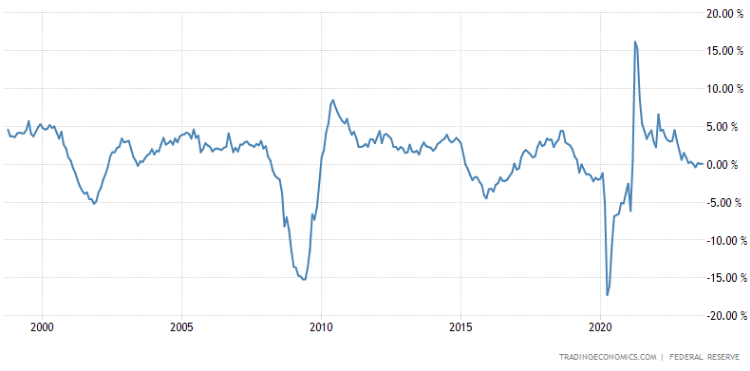
Retail Sales
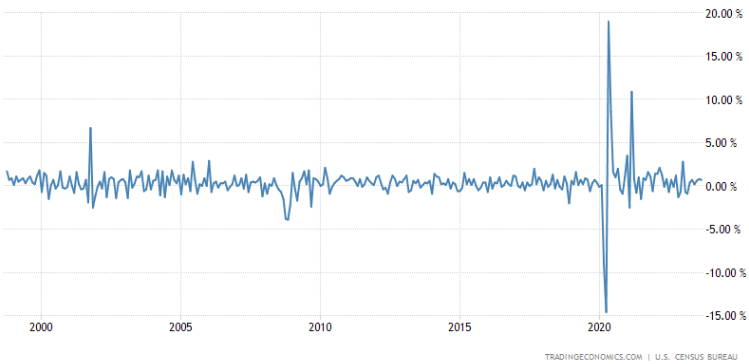
Non-farm Payrolls
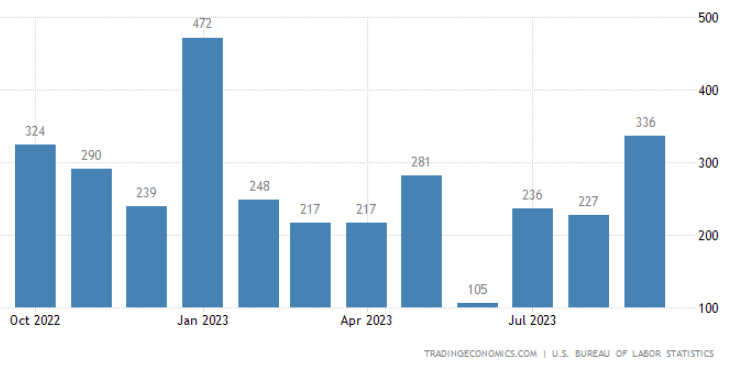
Total Vehicle Sales
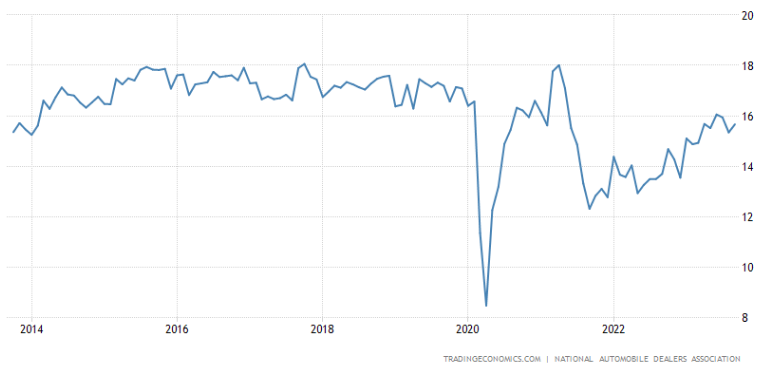
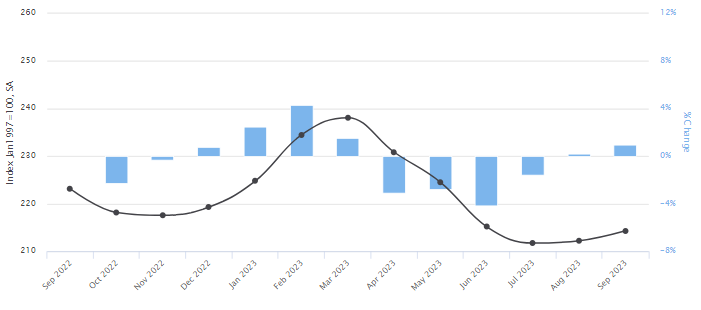
Manheim Used Car Index
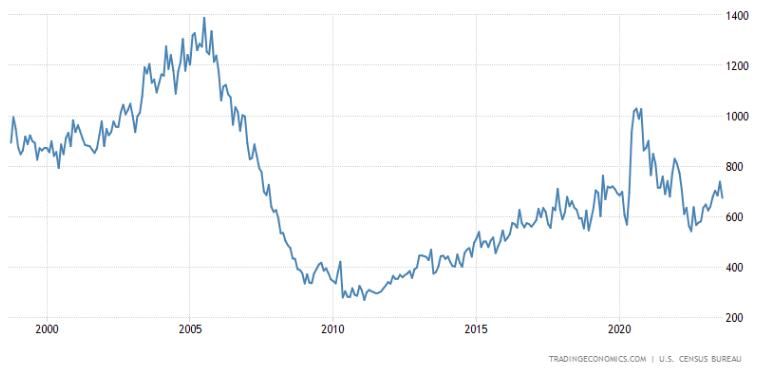
US New Home Sales
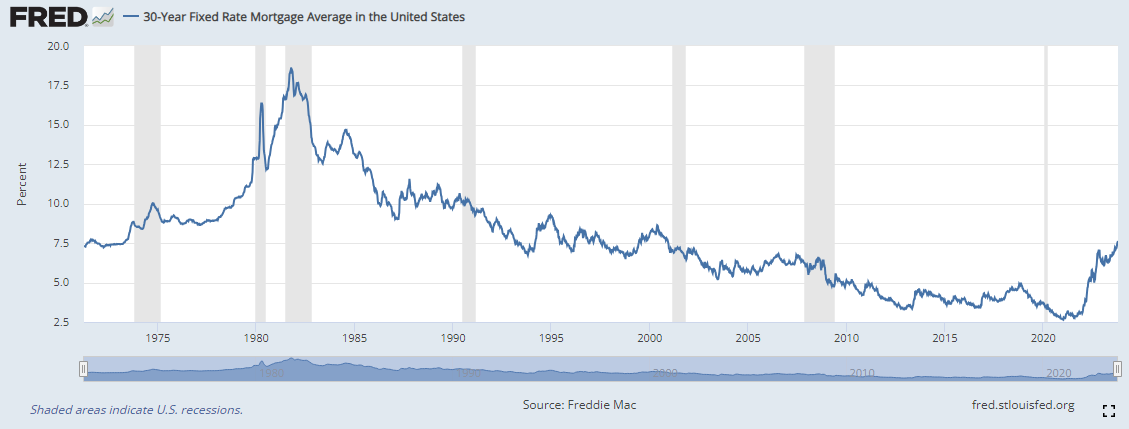
30 Year Fixed Mortgage Rates
The mortgage rates have climbed higher along with 10-year Treasury yield over the last month as FED rhetoric has pushed interest rate expectations a bit higher. The mortgage rates are touching 7.63% now.
Employment Indicators
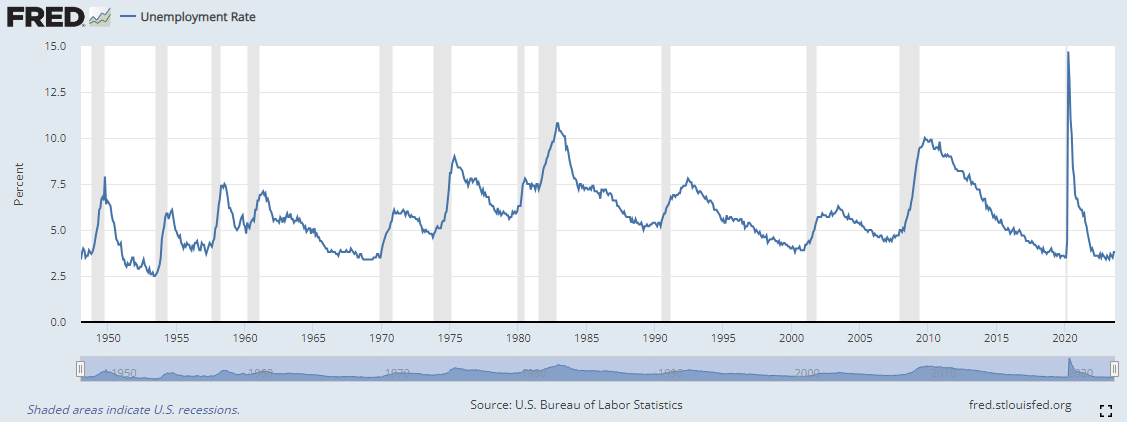
Historical Unemployment Rate
US Jobless Claims
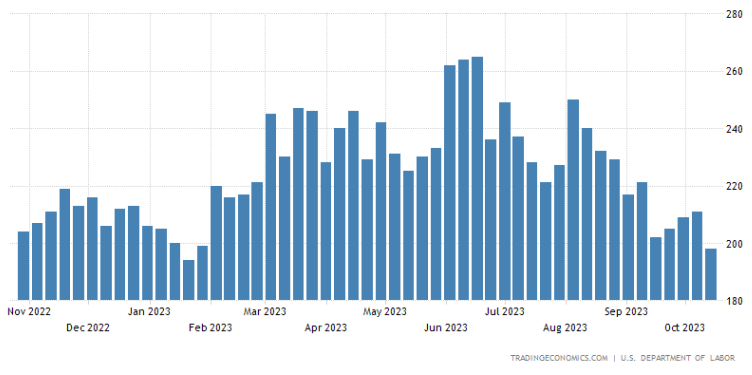
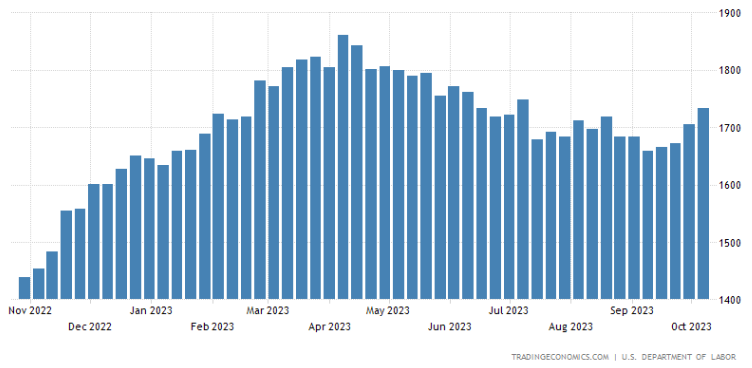 This chart will be the first indicator of a telltale sign that unemployment is increasing. As you see the continuing
jobless claims number rise, it implies the people who lost their jobs are not going back to labor force fast enough
and the unemployment rate is starting to creep higher. Over the last couple of weeks, it has trended lower, indicating
a robust jobs market.
This chart will be the first indicator of a telltale sign that unemployment is increasing. As you see the continuing
jobless claims number rise, it implies the people who lost their jobs are not going back to labor force fast enough
and the unemployment rate is starting to creep higher. Over the last couple of weeks, it has trended lower, indicating
a robust jobs market.
Indeed Job Postings
Wage Growth Tracker
Market Indicators
Yield Curve Inversion
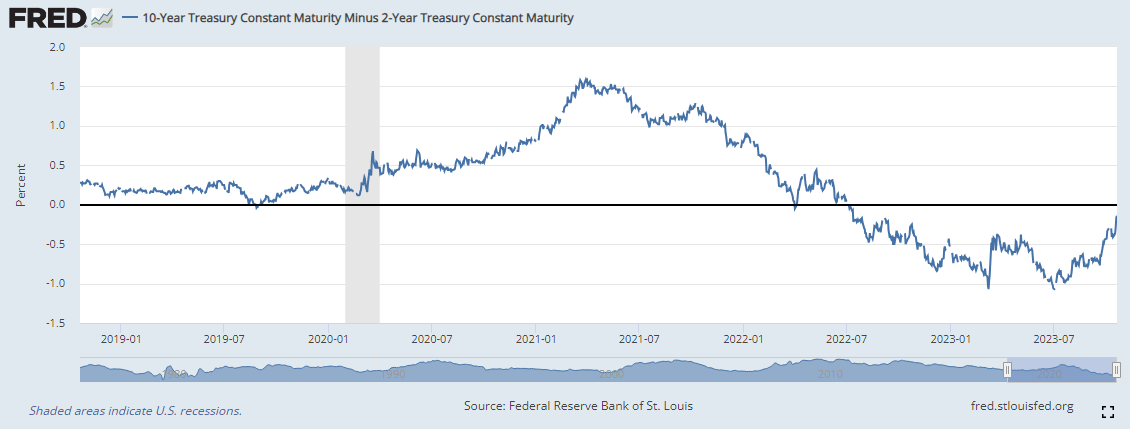
Yield Curve - then and now
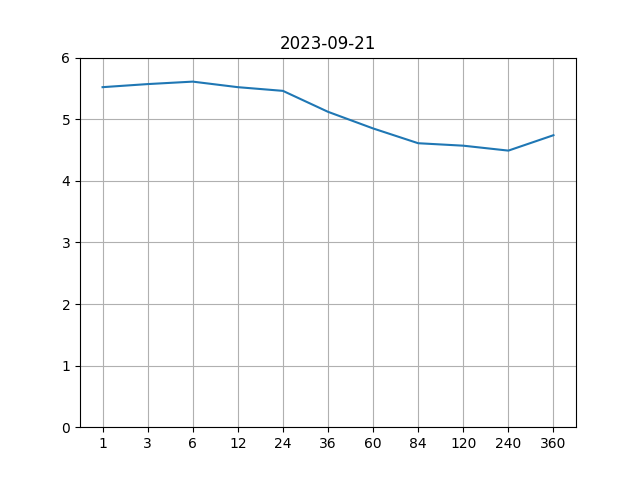 Yield curve - Then
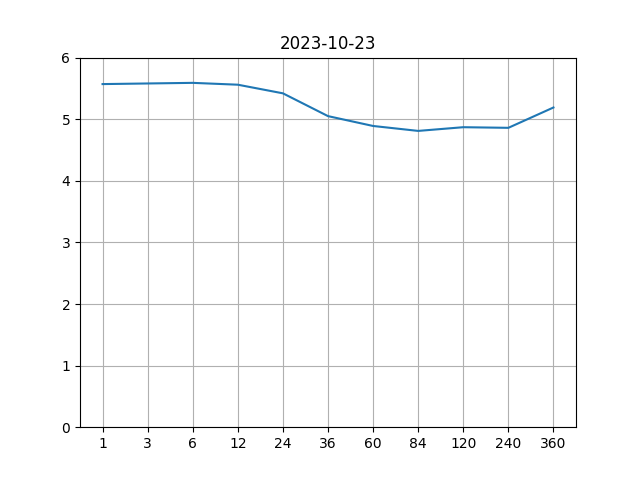 Yield curve - Now
 Notice how the long end of the curve has risen! This has been the driver of many a price moves in the markets this month.
Market Sectors
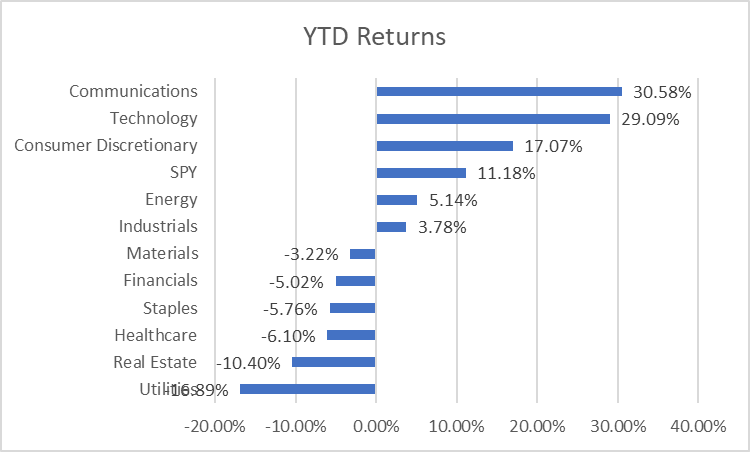
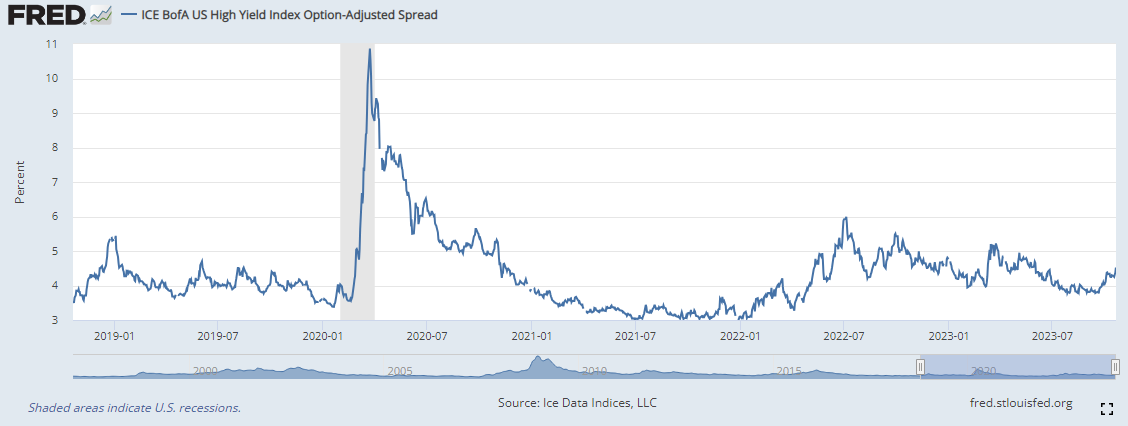
High Yield Index Options-Adjusted Spread
If the economy were to enter a recession, it is likely that some of the companies will struggle to keep up with their debt payments causing their credit spread to widen. This indicator shows how the credit spreads have been behaving so far.
The spreads have been very tight and there are no spikes in the spread observed yet to indicate a potential credit crunch. Some market participants are taking the cue from the equity markets to suggest high yield may be getting into risky territory and we may see some spikes fairly soon.
Put Call Ratio
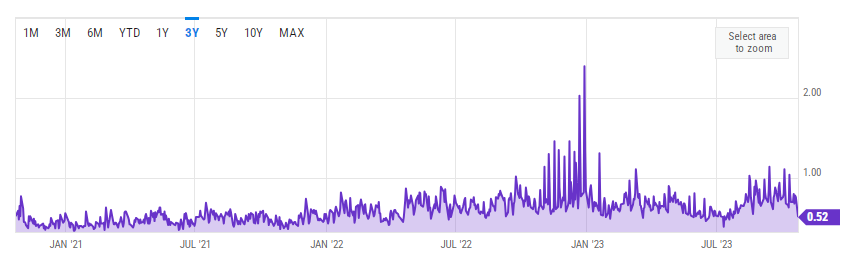
A spike in put / call ratio indicates that investors are very apprehensive about a sudden fall in the equity markets. In September/October, we have seen some interesting activities but nothing out of the ordinary. The VIX index has climbed recently due to the tensions in the middle east.
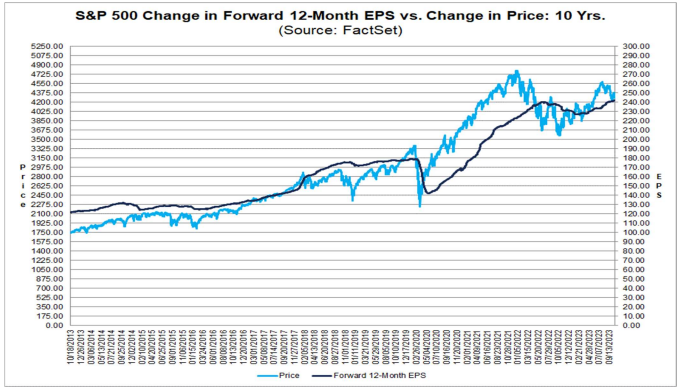
S&P 500 Current Valuations
The current earnings forecast by equity analysts estimate the earnings potential for S&P 500 companies to be around $240 which translates to a price to earnings ratio of 17.7 at the current S&P 500 price level. This is below the 5 year average but above the 10 year average.
As 10-year yield has increased and is likely to rise further, an expectation of slow down in the economy may depress the prices in the stock market.
Diclosures
- Trillium Square Advisors LLC is a registered investment adviser offering advisory services in the state of North Carolina and in other jurisdictions where exempted. Registration as an investment adviser does not imply a certain level of skill or training, and the content of this communication has not been approved or verified by the United States Security and Exchange Commission or by any state securities authority.
- Information presented is for educational purposes only and does not intend to make an offer or solicitation for the sale or purchase of any specific securities, investments or investment strategies. Market data, articles and other content in this presentation are based on generally available information and are believed to be reliable. Trillium Square does not guarantee the accuracy of the information contained in this presentation. The information is of a general nature and should not be construed as investment advice and relied upon in making investment decisions.
- Investments involve risk and are never guaranteed. Be sure to first consult with a qualified financial adviser before implementing any strategies discussed herein.
- Past performance is not indicative of future performance.
- The content of this communication and any accompanying documents are not to be copied, excerpted or distributed without express written permission of the firm. Any other use beyond its author’s intent, distribution or copying of the contents of this presentation is strictly prohibited. Nothing in this document is intended to be legal, accounting, or tax advise, and is for informational purposes only.
- Hypothetical performance results have many inherent limitations. No representation is being made that any account will or is likely to achieve profits or losses similar to those shown. In fact, there are frequently sharp differences between hypothetical performance results and the actual results subsequently achieved by any particular investment strategy. Hypothetical performance for illustration purposes only.
- Trillium Square will provide all prospective clients with a copy of our current Form ADV, Part 2A (Disclosure Brochure) upon request. At anytime you can view our current Form ADV, Part 2A at https://adviserinfo.sec.gov
© Copyright Trillium Square Advisors LLC. All rights reserved.